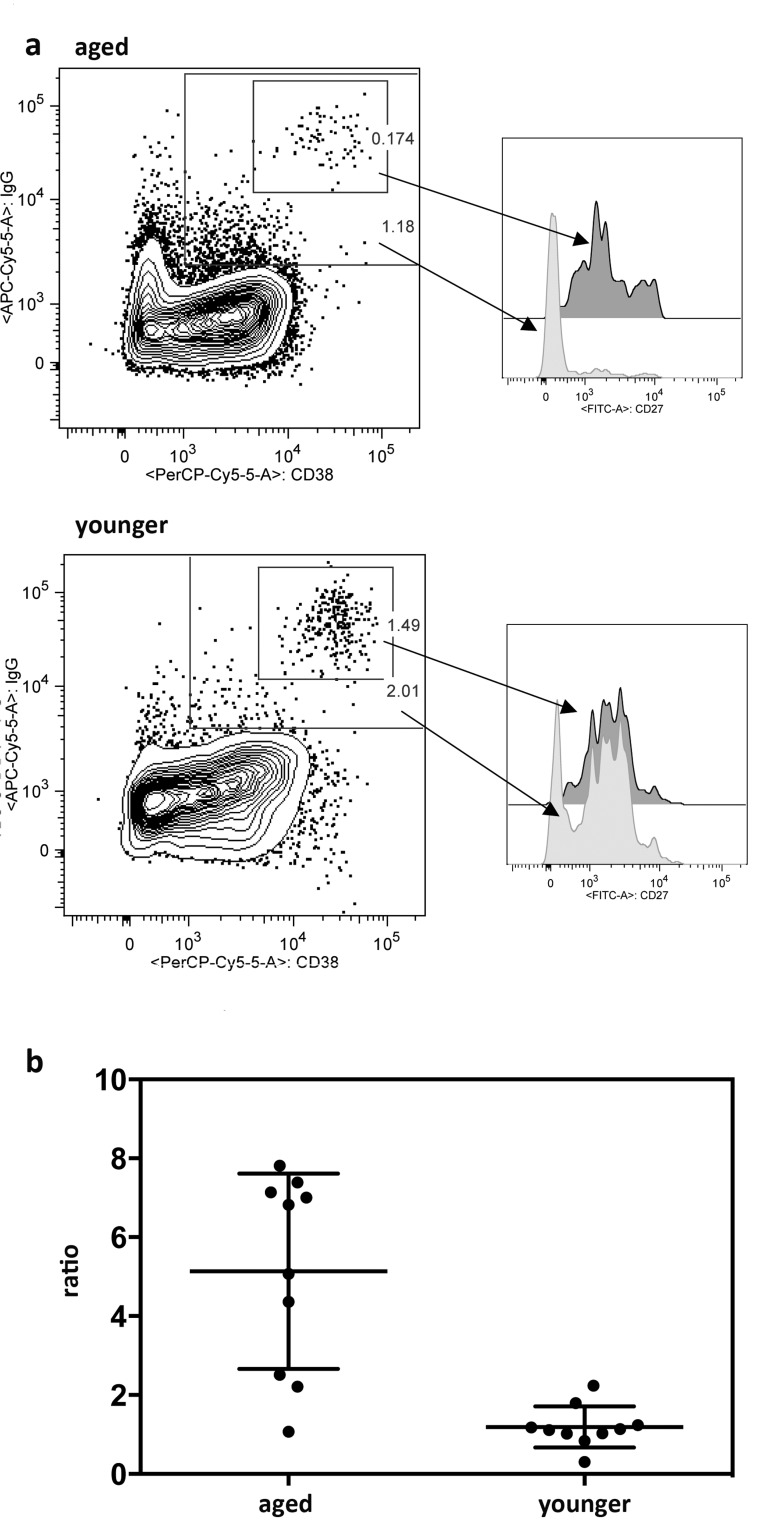
Figure 7.Expression of intracellular IgGIn 7a the graphs on the left show one representative example of PBMCs from one aged and one younger individual harvested 7 days after TIV vaccination. Cells were gated onto live CD3−CD14−IgD−CD20−CD19+ cells. They were then gated onto CD38 over IgG. The smaller gate shows CD38hiIgGhi cells, the larger gate shows cells that are CD38int-hi and IgGint-hi. Both gates were then as shown on the right gated onto CD27 over events. Dark histograms show CD27 expression on CD38hiIgGhi cells, lighter histograms show CD27 expression on CD38int-hiIgGint-hi. 7b shows the ratios of normalized cells obtained with the CD38int-hiIgGint-hi gate as shown in (a) or the traditional ASC gate as shown in Figure 5. Graph shows results for day 7 post vaccination PBMCs of 10 individual aged and 10 younger subjects. Means and SDs are shown. cells.
Figure 7 — B cell responses to the 2011/12-influenza vaccine in the aged | Aging