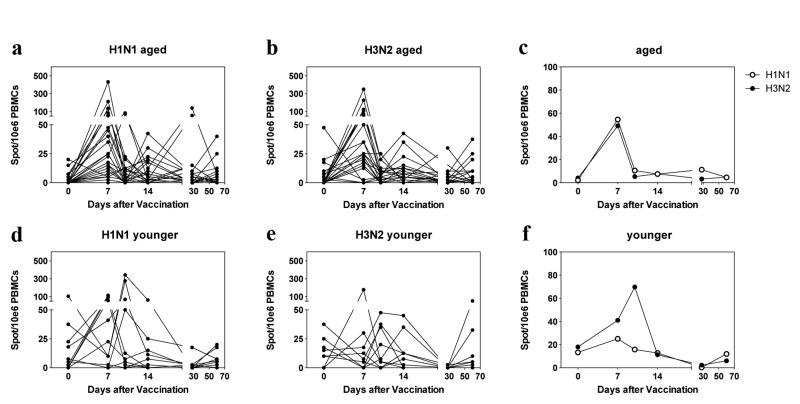
Figure 3.ELISpot ResultsSpots per 106 live PBMCs are shown for individual samples in (a), (b) (aged) and (d), (e) (younger). c and f show mean results for aged and younger subjects. The graphs are arranged as in Figure 1.
Figure 3 — B cell responses to the 2011/12-influenza vaccine in the aged | Aging