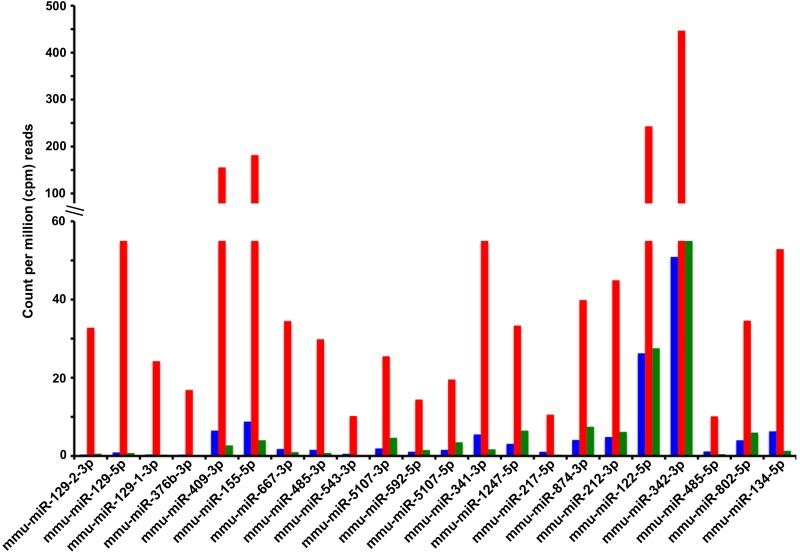
Figure 3.Known miRNAs for which calorie restriction antagonizes an age-associated increase in circulating levelsShown are the serum levels of miRNAs (Y-axis) derived from the miRNA genes indicated in the X-axis (labeled with miRBase v.19 terminology). Serum levels of miRNAs are reported as the average counts per million (cpm) reads in the sequenced libraries from the 3 experimental groups: young control (blue bars), old control (red bars), and old CR (green bars). The fold change and p-values of the age and CR effects on these and other circulating miRNAs are reported in Table 2.
Figure 3 — Deep sequencing identifies circulating mouse miRNAs that are functionally implicated in manifestations of aging and responsive to calorie restriction | Aging