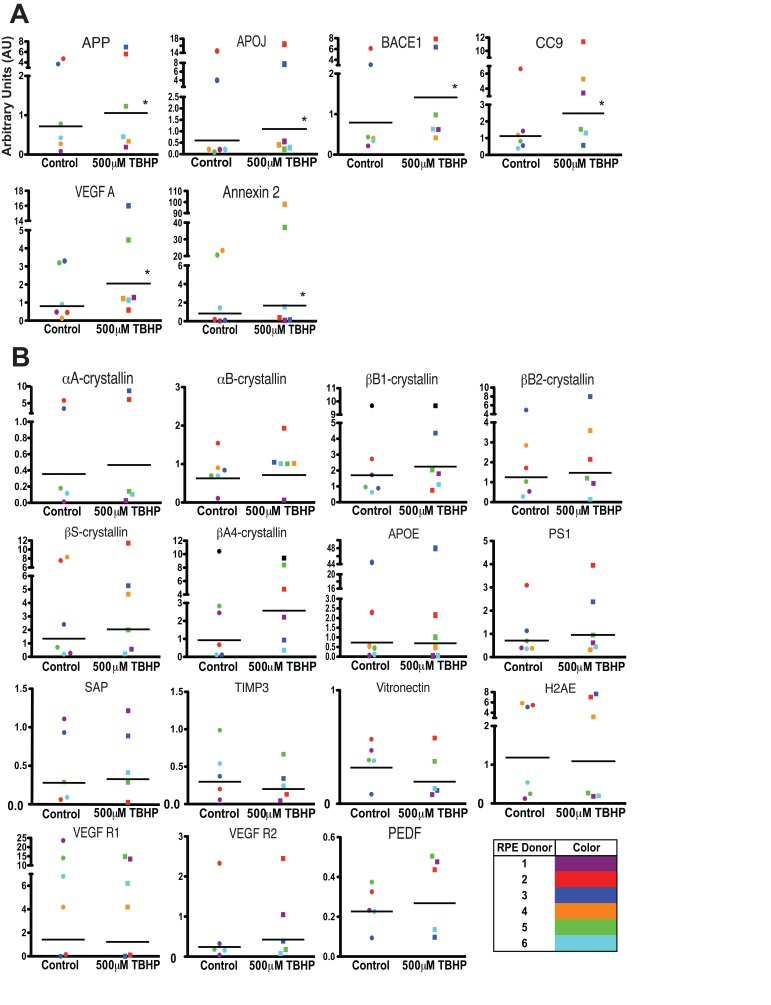
Figure 4.Individual donor variation in response to 5 days TBHP and a set of 6 consistently upregulated transcriptshRPE (n=6) were exposed to 500μM TBHP for 2 hours each day for 5 days and mRNA was quantified using qPCR. (A) Relative quantitation identified 6 transcripts with significantly higher mean expression levels after TBHP treatment compared to controls (Wilcoxon Matched Pairs Test *, p<0.05). hRPE mRNA was quantified relative to housekeeping genes (S18 ribosomal RNA and GAPDH) as well as to the mean of vehicle-treated control hRPE for each transcript across all donor cell lines. (B) 15 of the drusen-related transcripts did not show consistent upregulation after TBHP treatment. hRPE donors are indicated by color. The bar represents the geometric mean.