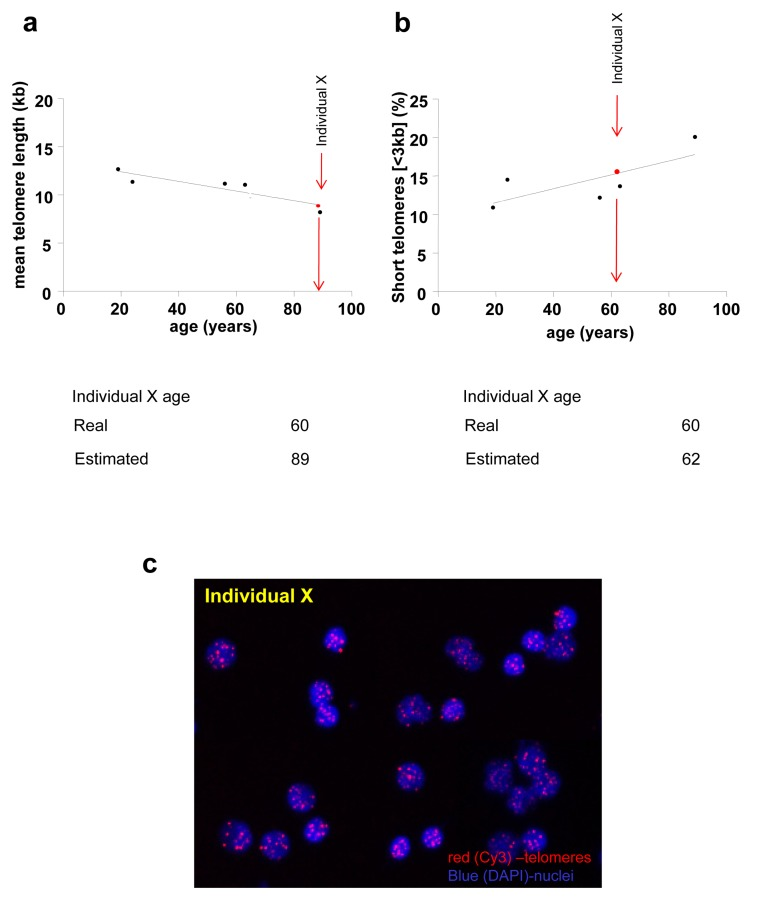
Figure 6.Biological age estimation from a given mean telomere length (a) or a percentage of short telomeres (b) of a given individual (Individual X)Biological age of individual X is estimated extrapolating mean telomere length (a) or the percentage of short telomeres (b) of individual X in the standard telomere length shorten-ing line based on the telomere length of healthy individuals. Standard line is fitted with 5 individuals for illustrative reasons; real standard lines are not shown. (c) Representative HT Q-FISH images of PBMC interphase nuclei. Telomeres are stained with Cy3 (red) and chromosomes are stained with DAPI (blue).