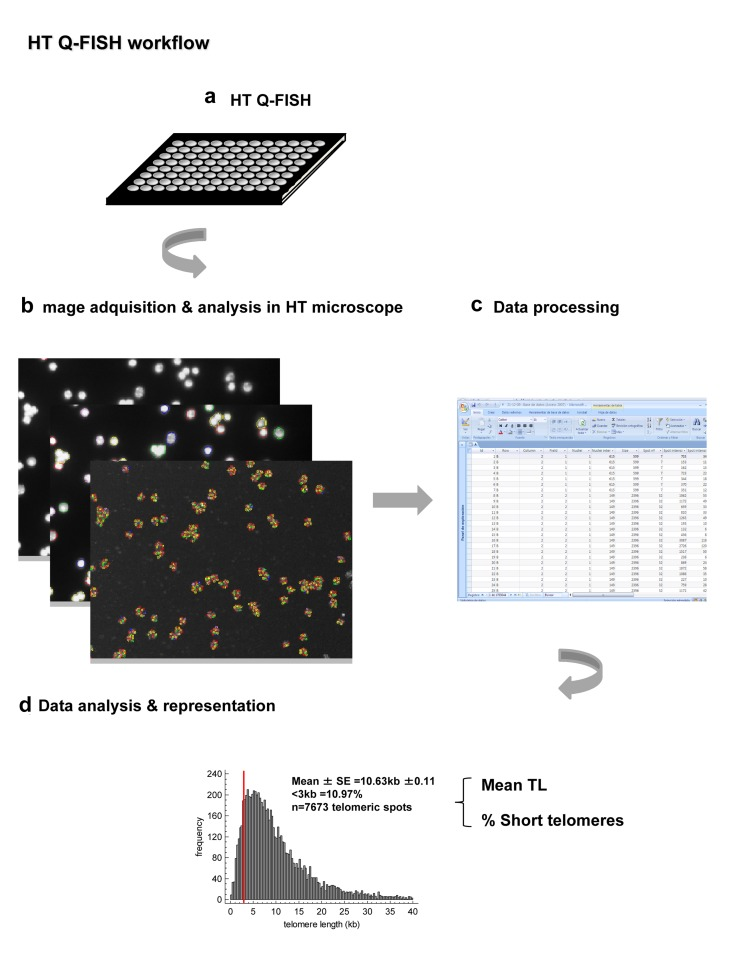
Figure 4.Summary of the main steps of the improved HT Q-FISH method(a) HT Q-FISH method is performed on 96 ell plate. Telomeres are labeled with fluorescent PNA probe against the telomeric repeats and nuclei are counterstains with DAPI. Cells are fixed with methanol:acetics. (b) Images are acquired and analyzed in a HT confocal microscope. (c) The data corresponding to the intensity of each one of the telomere spots are obtained and process. (d) A frequency histogram of telomere spots is obtained for each sample, allowing the quantification of the frequency of low intensity telomere spots as estimates of the frequency of short telomeres.