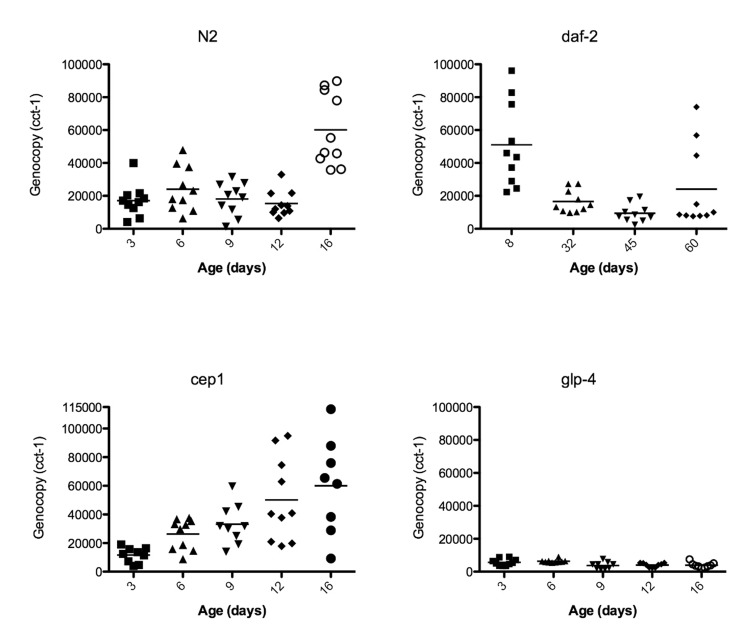
Figure 4.Genome copy number increases with the growth of uterine massesData points represent the genome copy number (y-axis) of individual worms at different ages (x-axis) as measured by digital PCR of individual worms with primers corresponding to genomic DNA of cct-1 gene. Graphs are of wild-type N2, glp-4, daf-2, or cep-1 worms.