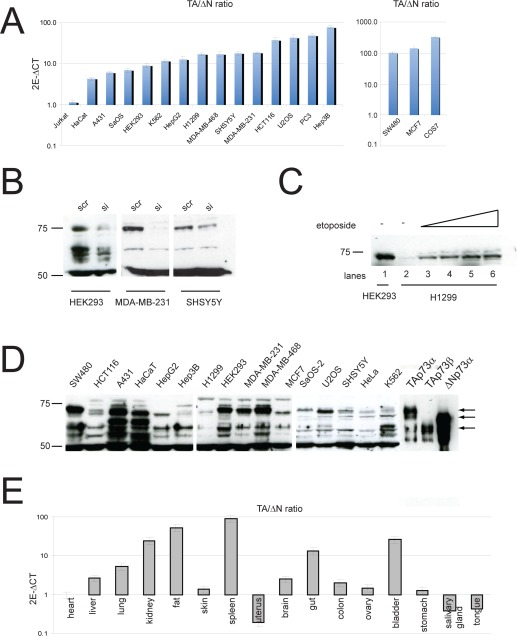
Figure 1.Expression of p73 isoforms(A) Total RNA was isolated from different cell lines as described before [5] and TAp73 and ΔNp73 expression were evaluated by real-time PCR with the TAp73 and ΔNp73 specific primers. (B-C) Validation of p73 antibody using either specific siRNA against p73 or induction of its expression by etoposide. Endogenous p73 was silenced in indicated cell lines and 50 ug protein was used to detect p73. Specificity of the antibody was also verified by detecting up-regulated TAp73 in H1299 cells following treatment with 20-50 uM etoposide for 24 h. (D) Western blot analysis of p73 isoforms in different cell lines. 50 ug protein was used to detect endogenous p73 protein. (E) Total RNA was isolated from different tissues and TAp73 and ΔNp73 expression were evaluated by real-time PCR as in panel A.