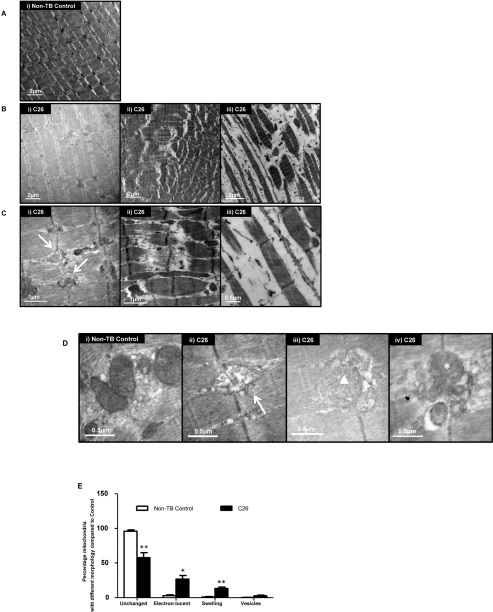
Figure 3.Ultrastructural changes in GAS
(A) Representative electron micrograph of muscle from non-tumor-bearing (non-TB) control mice. Magnification: × 8000. (B) Representative electron micrographs of muscle from C26-bearing mice. Magnification: × 8000 (i & ii), × 10000 (iii). (C) A higher magnification of muscle from C26-bearing mice. Vesicle-like structures (arrow); apparent tearing of myofiber (asterisk). Magnification: × 25000 (i & ii), × 30000 (iii). (D) Representative electron micrographs of muscle highlighting the morphologies of mitochondria. Electron-lucent areas (arrow); swelling (triangle); vesicle-like structures (asterisk). Magnification: × 40000 (i, ii & iv), × 30000 (iii). (E) Percentage of mitochondria with different morphologies in C26-bearing and non-TB mice. Data are presented as arithmetic means ± SEM. *p < 0.05, **p < 0.01 (n = 3). A reduced proportion of normal mitochondria and increased percentage of abnormal mitochondria with various changes were seen in C26-bearing mice compared to non-TB animals.