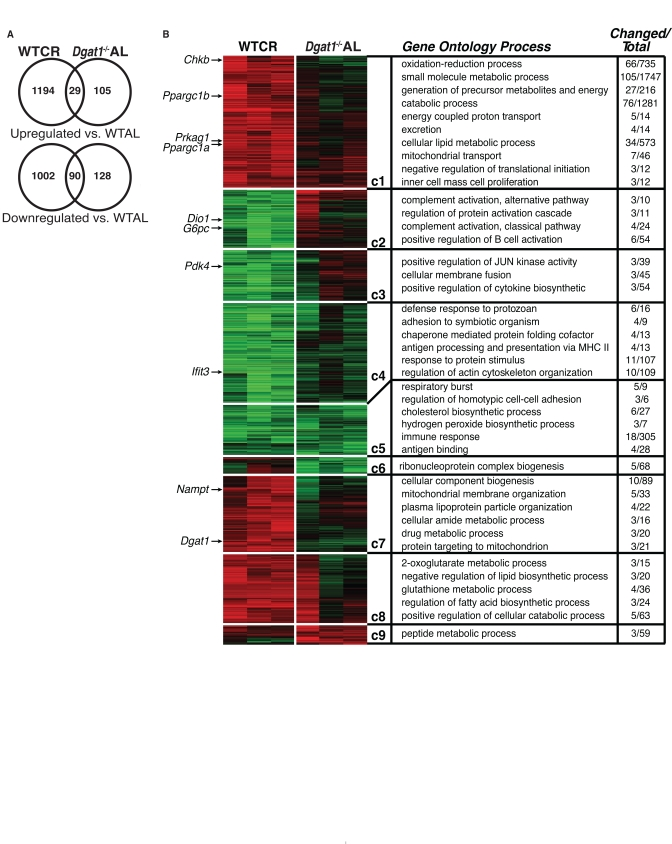
Figure 4.Comparative gene expression and pathway analysis of calorie restricted and Dgat1-deficient female mice(A) Differentially expressed genes (fold>1.3, non-adjusted t-test p<0.05) in the livers of WT calorie restricted (WTCR) vs. WT ad libitum mice (WTAL) compared to Dgat1−/− ad libitum (Dgat1−/− AL) vs. WTAL. (B) Gene-expression profiles (vertical axis) and biological replicates (horizontal axis) are shown in the context of the HOPACH cluster map. Ordered root HOPACH clusters (C1-9) represent significantly up-regulated (red) or down-regulated (green) genes relative to WTAL (WTAL data excluded). Over-represented cluster Gene Ontology and pathway terms (GO-Elite) are shown for the top-ranking distinct processes based on a permuted p-value. Dgat1 and genes previously associated with CR are indicated by an arrow next to the location of the corresponding gene probe set in the cluster map.