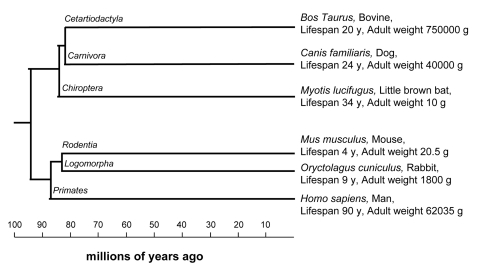
Figure 1.Phylogenetic tree showing relationship among species included in this studySpecies were chosen from different orders (i.e. having a relatively high evolutionary distance) and so that maximum longevity and adult weight cover a wide range of values without bias towards a single branch. Order names are indicated on branches, species name are shown with relative common name, maximum longevity (expressed in years) and adult weight (expressed in grams), data are from the work of De Magalhaes and co-workers [22]. Phylogenetic relations were from the work of Springer and co-workers [S2].