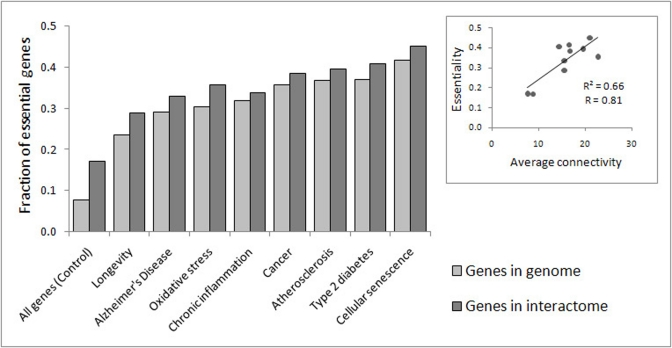
Figure 3.Fraction of genes which are essential to growth and development in each of the gene sets under analysis. The difference between each set and all genes (control) was highly significant (p < E-25). Insert: The correlation between essentiality and average connectivity (R – Pearson's coefficient of correlation; p = 0.004).