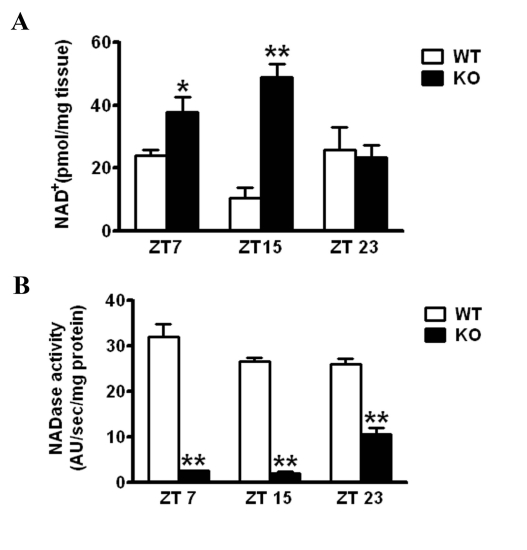
Figure 1.Effect of CD38 on NAD+ levelsWT and CD38 KO mice entrained in 12 hr Light - 12 hr Dark (LD) cycles were sacrificed at indicated times and their liver was dissected out. (A) NAD+ concentration was measured by a cycling enzymatic assay. *, p<0.05 (WT vs KO ZT7); **, p<0.001 (WT vs KO ZT 15) [n=3 each time point] (B) NADase activity was measured by a flurometric assay. **, p<0.001 (WT vs KO for each time point) [n=3 each time point].