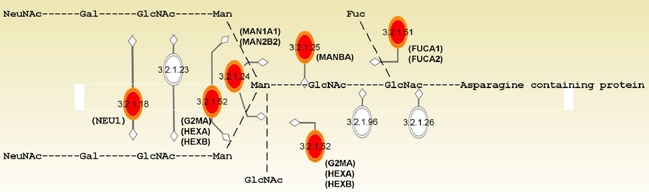
Figure 3.N-glycan degradation pathway enriched by pathway analysis.Enzymes (in EC number) with their names of coding genes and the corresponding sites of actions in the modification of N-glycan are indicated. Genes (n=9) that are differentially expressed with age and enriched by IPA analysis are marked in red.