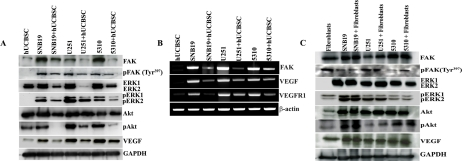
Figure 2.Downregulation of angiogenesis related proteins by hUCBSC.(A) Equal amounts of proteins (40μg) from the single and co-cultures were loaded onto 8-14% gels and transferred onto nitrocellulose membranes, which were then probed with respective antibodies. GAPDH was used a positive loading control. (B) Reverse-transcription based PCR analysis of single and co-cultures of glioma cells showing expression of FAK, VEGF, VEGFR1 and β-actin. (C) Single and co-cultures of glioma cells with fibroblasts showing expression of proteins by immunoblot analyses. The results are from 3 separate experiments.