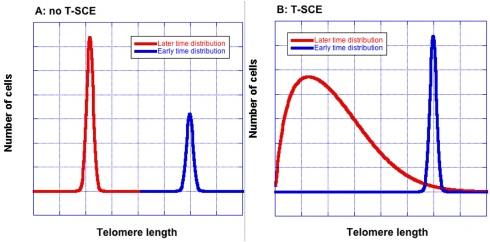
Figure 1.T-SCE broaden the telomere size distribution.Without T-SCE (Panel A), the shape remains unchanged as average telomere length decreases. Blue and red curves show telomere lengths at earlier and later times respectively. With T-SCE (Panel B), the distribution becomes wider with increasing cell divisions. The curves were created using an equation that was derived to allow quick, approximate calculations of T-SCE effects [9]; they are for illustration only and are not drawn to scale.