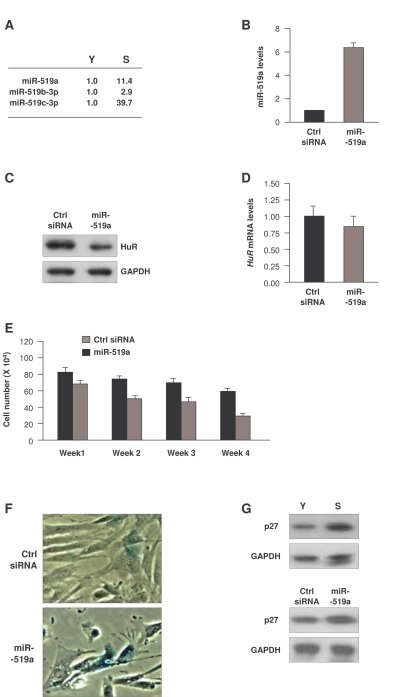
Figure 4.Influence of miR-519 on WI-38 senescence.(A)
Fold differences in miR-519 expression in S relative to Y cells, calculated
as explained in the legend of Figure 2. (B) Forty-eight h after
transfection of either control (Ctrl) siRNA or miR-519a, the levels of
miR-519a were measured by RT-qPCR. (C,D) In cells transfected as
explained in panel (B), the levels of HuR protein and loading control GAPDH
were assessed by Western blot analysis (C), and the levels of HuR
mRNA and normalization control 18S rRNA were measured by RT-qPCR (D). (E)
WI-38 cell numbers in cells transfected as in (B) were counted every 7
days. (F) SA-β-galactosidase activity in WI-38 cells by week 4
after sequential transfection (every 7 days) of either Ctrl siRNA or
miR-519a. (G) Western blot analysis of p27 and loading control
GAPDH in Y and S WI-38 cells (top) or in WI-38 cells by week 4 after
transfection as explained in (E) (bottom). The data in B,D,E
represent the means and S.D. from three independent experiments.