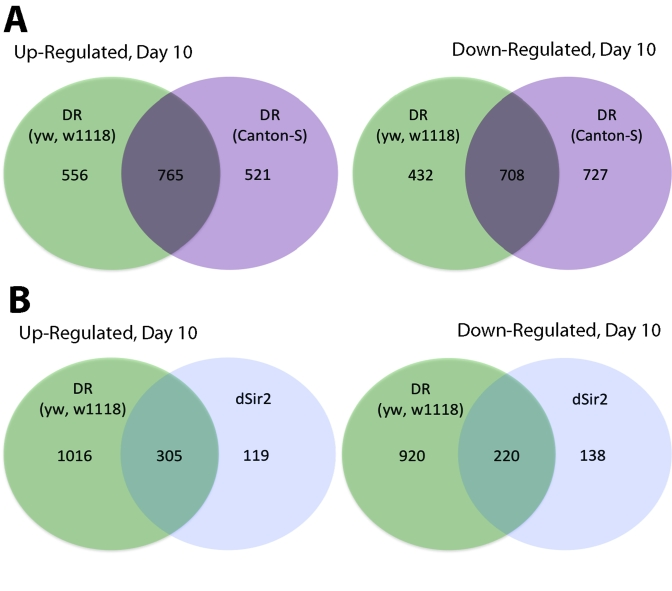
Figure 1.Comparison of genes upregulated and downregulated in yw/w 1118 DR, Canton-S CR and dSir2 overexpressed long-lived flies at Day 10. (A) Venn
diagram comparing the upregulated and downregulated genes for DR flies in a yw/w1118
and a Canton-S background at age 10 days. (B) Venn diagram comparing
upregulated and downregulated genes in DR long-lived flies and dSir2 overexpressing
long-lived flies at age 10 Days. DR flies and dSir2 overexpressing flies are in
an identical genetic background. The majority of genes expressed in dSir2
overexpression are also expressed in DR (72% upregulated and 61% downregulated).
Verification of microarray data using qPCR is in Supplementary Figure 3.