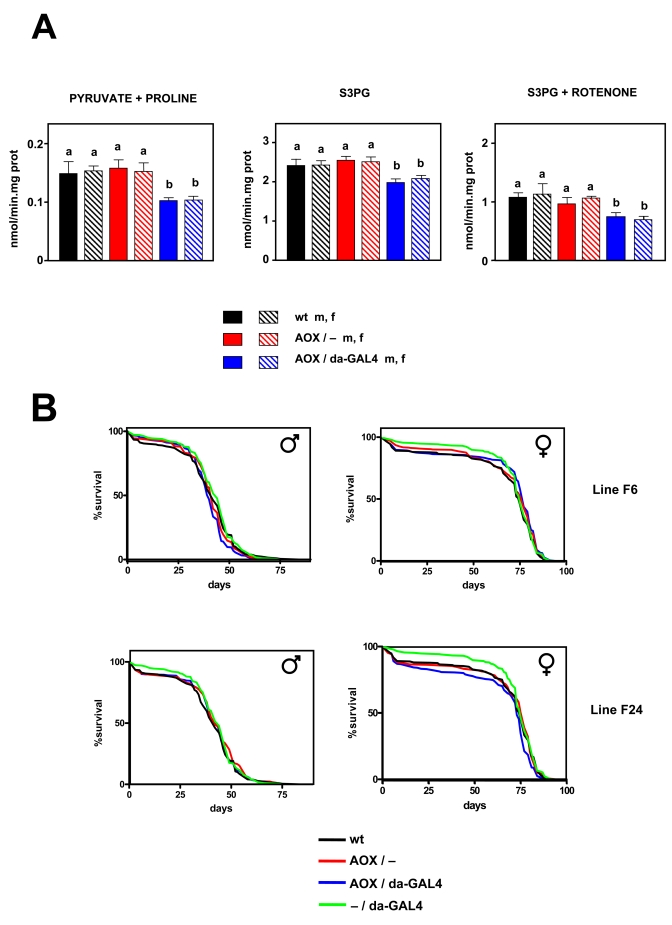
Figure 3.Effect of AOX expression on mtROS production and lifespan.(A) mtROS
production (mean +
SEM). a, b: statistically significant differences
between groups (ANOVA, p < 0.05, n=4-8 samples per group) m:
male, f: female. (B) Survival curves for wild
type (wt), AOX non-expressing (AOX / -), AOX expressing (AOX / da-GAL4 +),
and driver only (- / da-GAL4) flies, all in the DAH (w-)
background. Flies of AOX transgenic lines F6 and F24 as indicated. Combined
data from two independent experiments using 200 flies per group per
experiment. Mean, maximum life spans (d) were: wt males (42,51); wt
females (75, 82); - / daGAL4 males (44, 54); -
/ da-GAL4 females (75, 81), F6 AOX / - females (77, 82); F6 AOX / - males
(42,51); F6 AOX / da-GAL4 males (40,47); F6 AOX / da-GAL4 females (82,
51); F24 AOX / - males (42, 54); F24 AOX / - females (77, 81); F24 F24 AOX /
da-GAL4 males (42, 54); AOX / da-GAL4 females (73, 80).