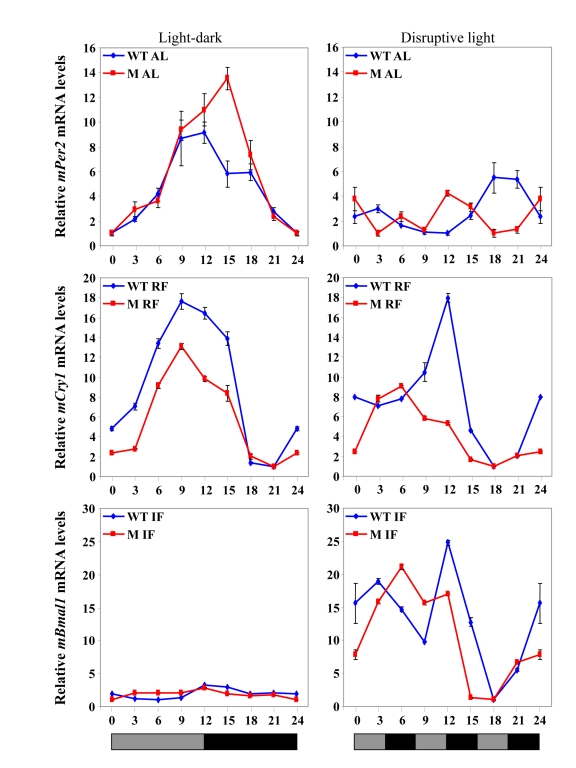
Figure 5.Clock gene expression in the liver under various feeding and lighting conditions in αMUPA (M) and WT mice. Expression levels
of the following clock genes are presented under light-dark or disruptive
light conditions:mPer2during ad
libitum (AL) feeding, mCry1 under RF, and Bmal1 under IF.Total
RNA extracted from liver tissue collected every 3 h around the circadian
cycle (mean ± SEM; n=3 for each time-point and each mouse group) was
reverse transcribed and analyzed by quantitative real time PCR. Clock gene levels
were normalized using Gapdh as the reference gene.