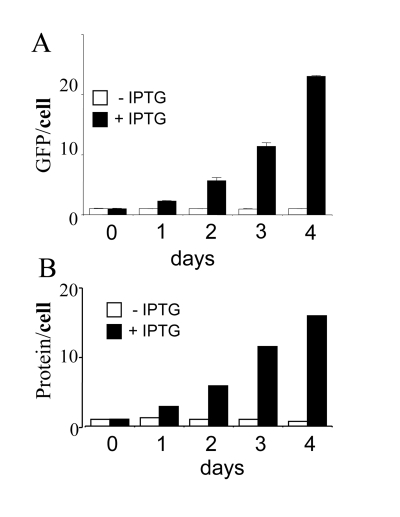
Figure 3.Cellular hypertrophy during senescence induction.
HT-p21 cells were grown in 60 mm wells and cell numbers, soluble protein
and GFP were measured daily. Closed bars: HT-p21 cells were treated with
IPTG (+IPTG). Open bars: Untreated HT-p21 cells (-IPTG). Protein per cell
and GFP per cell
were constant in proliferating (-IPTG) cells. Protein per cell
and GFP per cell increased exponentially in non-proliferating (+IPTG) cells.