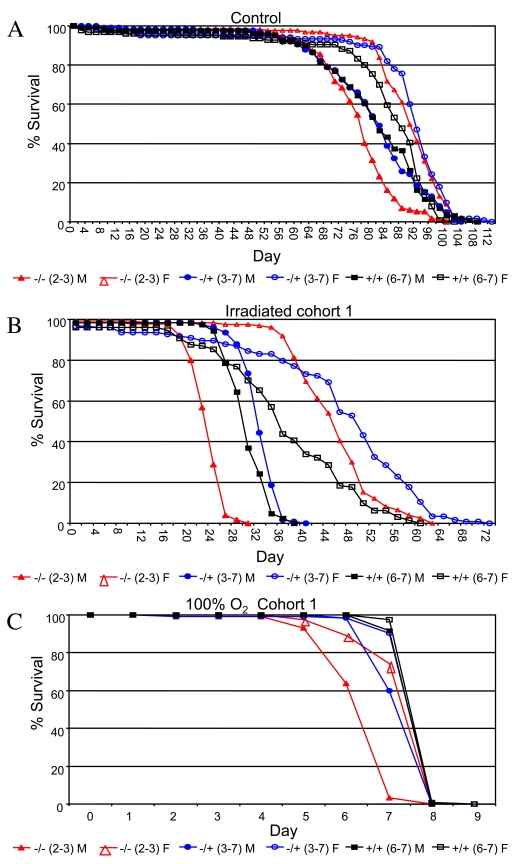
Figure 4.Survival curves for the indicated genotypes under stress conditions.
(A) Ionizing radiation. (B) 100% oxygen survival. A key of p53 genotypes
is presented below the graphs. Males are indicated with solid symbols and females
are indicated with open symbols. Survival curves for replicate experiments (cohort 2)
are presented in Supplementary Figure 5. Survival statistics for these and replicate
experiments are summarized in Supplementary Table 9.
Figure 4 — Drosophila melanogaster p53 has developmental stage-specific and sex-specific effects on
adult life span indicative of sexual antagonistic pleiotropy | Aging