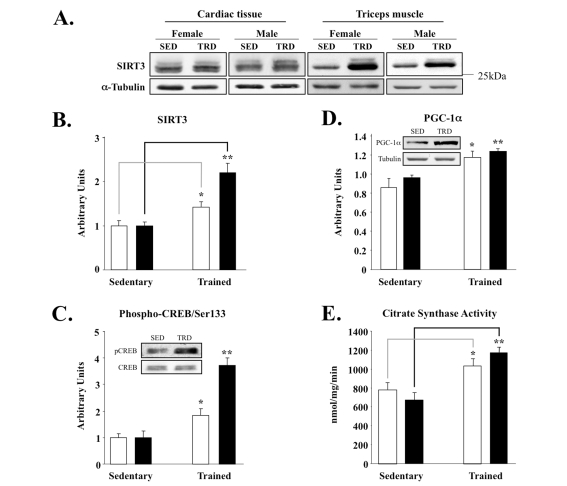
Figure 2.Skeletal muscle-specific induction of SIRT3 and associated factors in exercise-trained mice. (A) Triceps or cardiac
muscle tissue was homogenized and 50 μg of protein was analyzed by
Western blot, using anti-SIRT3 serum (Covance) and α-tubulin control; representative
blots are shown here and throughout. SED = sedentary and TRD = trained. (B)
Quantification of SIRT3 band intensities using ImageQuant from blots with
animals grouped by sex. Males are plotted as clear bars and females as
shaded bars. Total number of animals used per cohort and graphed are as
follows: sedentary males, N = 7; sedentary females, N = 5; exercised males,
N = 8; exercised females, N = 6. (C) Phospho-CREB/Ser133 and total
CREB protein. Band intensities of phospho-CREB and CREB were quantified and
phospho-CREB content was normalized relative to total CREB content; inset
provides sample blots of male triceps tissue. (D) Induction of PGC-1α correlates with enhanced SIRT3
expression in triceps; samples processed and analyzed, as above. Inset
blots are of male triceps tissue. (E) Citrate synthase activity was
measured as a mitochondrial marker from the same triceps samples, as
described previously [40]. N = 2, *P <
0.05, **P < 0.01.