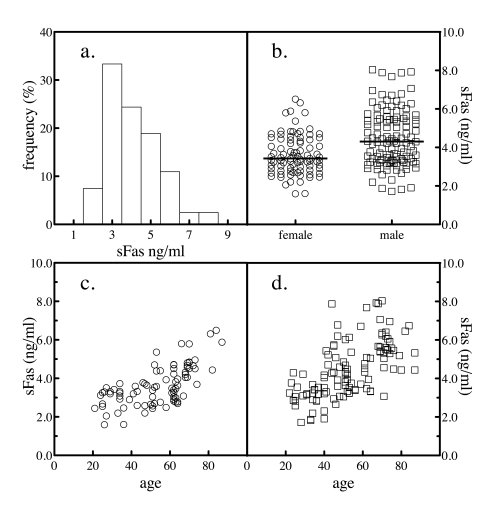
Figure 1.Serum sFas levels. The levels of sFas in 204 normal subjects was
determined by sandwich ELSA. The frequency distribution of the values
across the subjects was analyzed (a). The levels of sFas by gender
were plotted (b). The sample population was segregated by gender and
the levels of serum sFasL as a function of donor age for female (c)
and male (d) subjects were plotted.