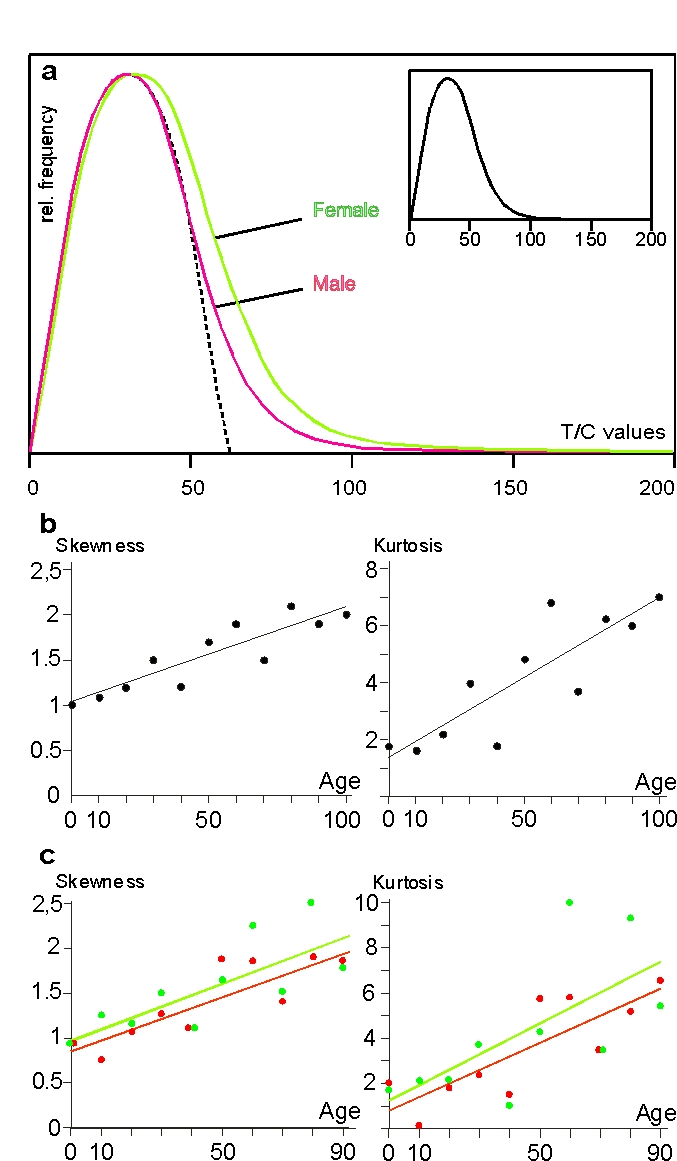
Figure 2.Erratic extensive elongation (EEE) of single telomeres in peripheral lymphocytes. (a) Histogram of telomere
lengths of all p and q arms of chromosomes of females (green)
and males (red). The dotted line represents the theoretical
Gaussian distribution, the histogram in the smaller insert
represents the curve of female and male values together. The
actual curves are skewed to the right. (b) Skewness and kurtosis
of telomere lengths of p and q arms of chromosomes of lymphocytes
in all age groups. Values are limited to 150 T/C values. (c)
Skewness and kurtosis of telomere lengths of p and q arms of
chromosomes of female (filled circles and green line) and
male probands (open circles and red line) ranging from newborns
up to 90 years. Centenarians are excluded because the male
group consists of only 2 persons. Values limited to 150 T/C
values as mentioned above. (see “Statistical analysis” for further details).