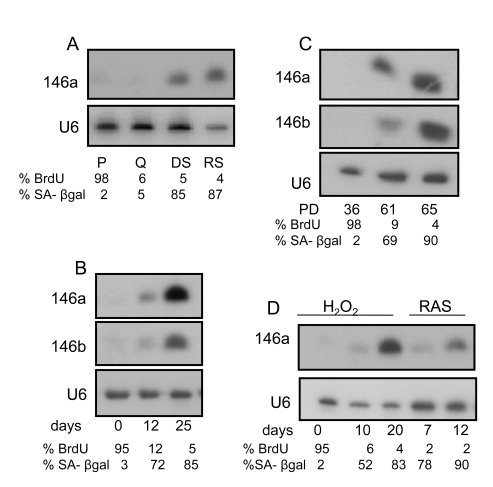
Figure 1.miR146a/b expression increases in senescent HCA2 fibroblasts.(A)
Northern blot analysis of total RNA prepared from proliferating (P),
quiescent (Q), damage (bleomycin)-induced senescent (DS) and replicatively
senescent (RS) HCA2 cells. We analyzed 10 μg of RNA from P, Q and DS
cells, but 5 μg of RNA from RS cells. After separation and transfer to
membranes, the blots were probed for miR-146a. Equal RNA loading was
confirmed by probing for the small RNA species U6. Values for the
percentage of cells incorporating bromodeoxyuridine (% BrdU) or expressing
the sensecence-associated beta-galactosidase (% SA-β-gal) are indicated
below each lane. (B) Northern blot analysis of RNA from DS cells.
Cells were harvested for RNA at the days indicated after cells were induced
to senesce by bleomycin. The blot was initially probed for miR-146a, then
stripped and reprobed for miR-146b. The proliferation levels (% BrdU) and
% cells that express the SA-β-gal are indicated. (C) Northern
blot analysis of replicatively senescencing cells. Cells were harvested at
the PD (population doubling level) indicated below the figure. The
proliferation levels (% BrdU) and % cells that express the SA-β-gal
are indicated. (D) Northern blot analysis of cells treated with H2O2
(0.1 mM for 2 h) or infected with the lentivirus expressing oncogenic RASV12. Cells were harvested for RNA at
the indicated days after treatment. The proliferation levels (% BrdU) and % cells that express the
SA-β-gal are indicated.