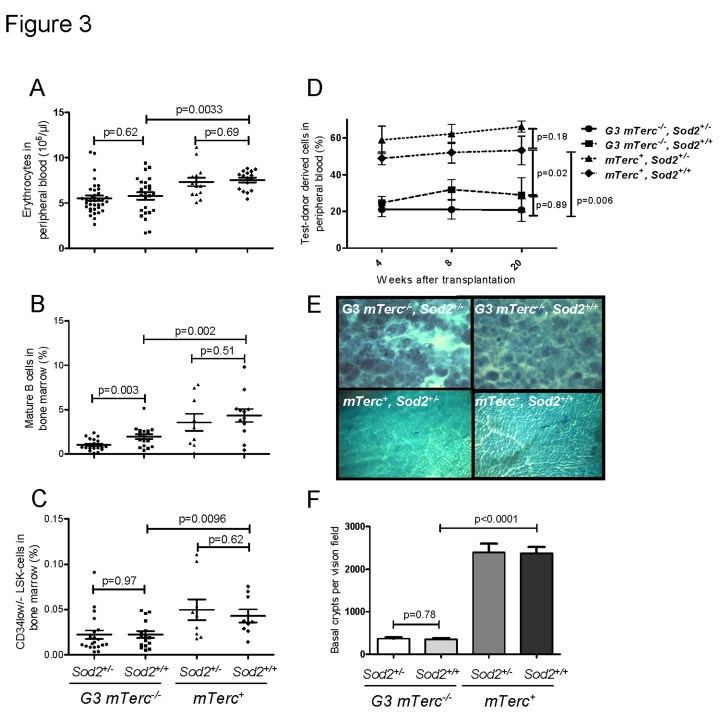
Figure 3.(A)
Number of erythrocytes per ul of peripheral blood ± SEM in 12 to 18
months old mice. (B) Percentage of mature B cells defined as IgD+
IgM+ B220+ CD43- cells in total bone
marrow cells of 12 to 18 months old mice. n=21 (G3 mTerc-/-,
Sod2+/-), n=17 (G3 mTerc-/-, Sod2+/+);
n=9 (mTerc+,
Sod2+/-) and n=12 (mTerc+,
Sod2+/+)
mice per group were analyzed by FACS. (C) Percentage of long term
hematopoietic stem cells defined as Lin- Sca+ cKit+
CD34-/low cells in total bone marrow cells of 12 to 18 months
old mice. n=9 to 20 mice per group were analyzed by FACS. (D)
Competitive transplantation of total bone marrow of Ly5.2 test donor cells
against Ly5.1 competitor cells. 8(10)5 cells of test donor cells
were transplanted along with 4(10)5 competitor cells into 1 to 3
young lethally irradiated recipients per donor. Four different donors were
used per group. White blood cell chimerism was verified at 1, 2 and 5
months after transplantation by FACS analysis. Data is shown as percentage
of donor derived chimerism ± SEM (E) Representative
pictures displaying the large intestine atrophy in telomere dysfunctional
mice wildtype and heterozygous for Sod2. (F) Bar graph
depicting the average number of intestinal crypts per visual field at a
magnification of 40X of whole mounts from n=8 (G3 mTerc-/-,
Sod2+/-), n=7 (G3 mTerc-/-, Sod2+/+);
n=4 (mTerc+, Sod2+/-) and n=4 (mTerc+,
Sod2+/+)
mice per group.