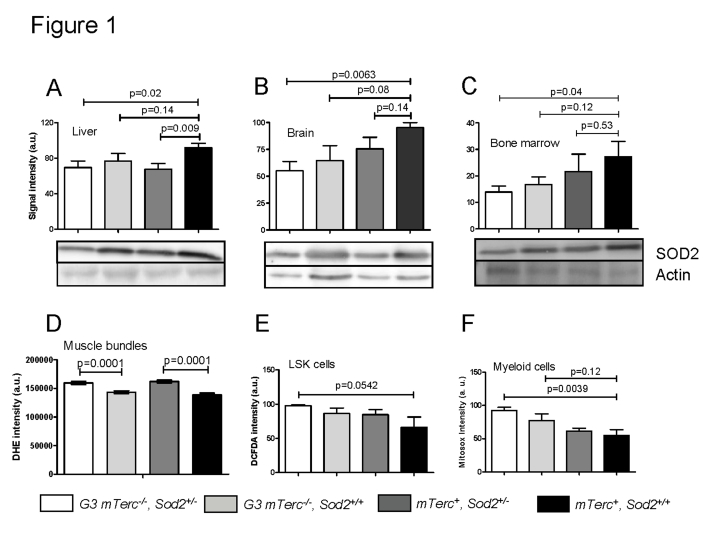
Figure 1.
Western blots
showing SOD2 levels in liver (A), brain (B) and bone marrow (C)
of 12 to 18 months old mice. Lower panels show representative western blots
and upper panels show quantification of normalized SOD2 levels to actin
controls from n=4 mice per group (1 to 2 repeat experiments per sample).
Data is shown in arbitrary units ± SEM. (D) Basal ROS levels in
muscle fibers stained with DHE. Signal quantification of G3
mTerc-/-Sod2+/- (n=235), G3 mTerc-/-(n=211) mTerc+, Sod2+/-(n=270 ) and mTerc+,
Sod2+/+
(n=203) nuclei from 5 mice per genotype. Data is shown as mean fluorescence
intensity ± SEM. (E) Antioxidant capacity of LSK cells. DCFDA loaded
bone marrow cells were incubated with 50 uM of antimycinA and DCFDA
fluorescence was monitored in Lin-Sca+cKit+ populations
by FACS analysis. Data is shown in arbitrary units ± SEM of n=4 mice per
group. (F) Antioxidant capacity of myeloid cells. Mitosox loaded
bone marrow cells were incubated with 20 uM antimycinA and mitosox
intensity monitored in myeloid population by FACS analysis. "Y" axis
denotes arbitrary units for fluorescence intensity of n=5 to 6 mice per
group.