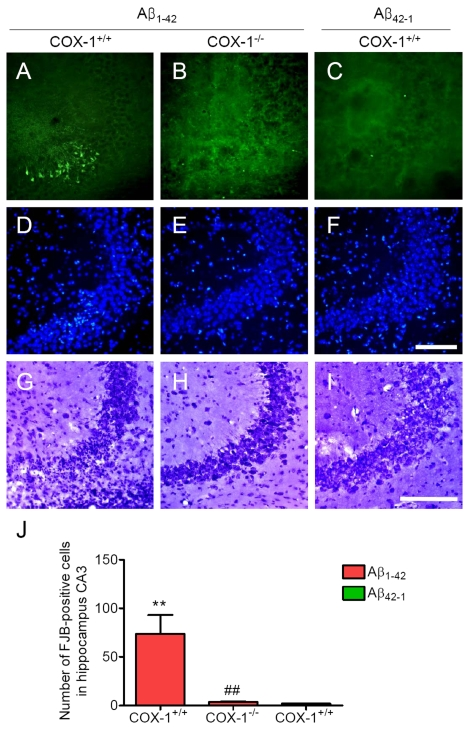
Figure 3.Increased degenerating neurons in the hippocampus 7 d after.Aβ1-42
administration. (A-C)
Representative photomicrographs of the CA3 of the hippocampus from WT mice
(A) injected with Aβ1-42 that shows numerous FJB-positive cells
compared with Aβ1-42-injected COX-1-/-
mice (B). Representative photomicro-graphs of DAPI (D-F) and
Nissl staining (G-I) in the CA3 of hippocampus from Aβ1-42-injected WT (D, G) and COX-1-/-mice (E, H).
Scale bar: A-I, 100 μm. (J) Comparison of the number of
FJB-positive cells from the CA3 area. Mean ± SEM (n = 3-4 per
group); **P < 0.01 compared with the Aβ42-1-injected
WT mice; ##P < 0.01 compared with the Aβ1-42-injected
WT mice.