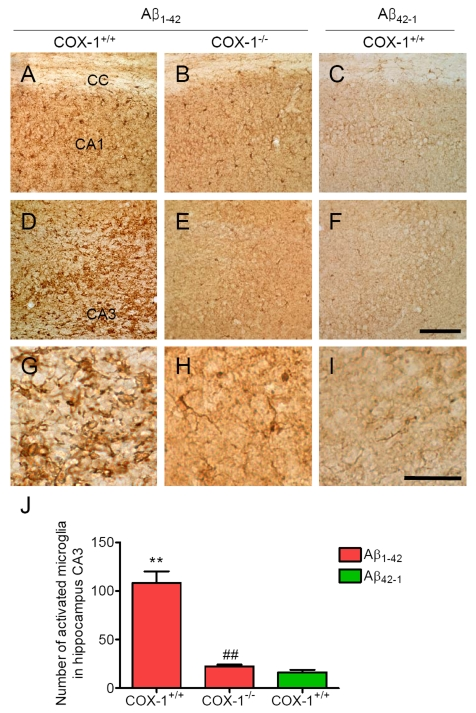
Figure 1.Increased microglial activation in the hippocampus 7 d after Aβ 1-42 administration. Representative
photomicrographs of the CA1 and CA3 of the hippocampus from WT mice (A,
D) injected with Aβ1-42
that shows numerous activated microglia with short, less-ramified
processes, perikaryal hypertrophy, and amoeboid appearance (G). CA1 and CA3 areas of the hippocampus from Aβ1-42-injected
COX-1-/- mice (B, E) show many resting microglia
with ramified morphology (H). Scale bar: A-F, 100
μm; G-I, 50 μm. (J) Comparison of the number of activated
microglia from the CA3 area. Mean ± SEM (n = 3-4 per group); **P
< 0.01 compared with the Aβ42-1-injected WT mice; ##P
< 0.01 compared with the Aβ1-42-injected WT mice.