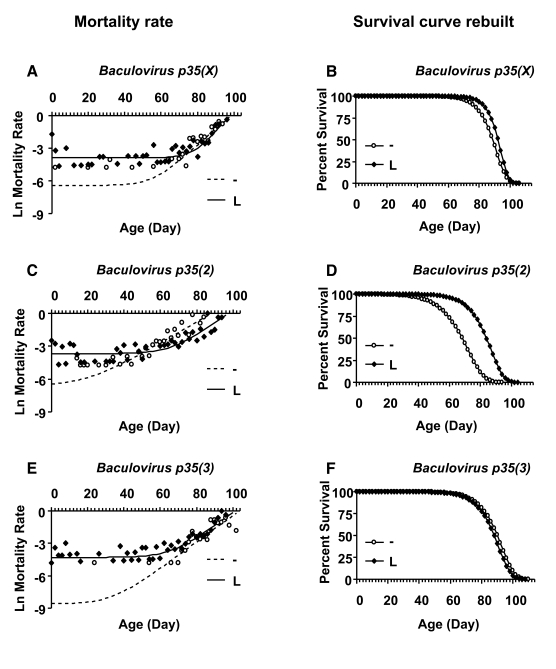
Figure 5.Mortality rate analysis of female larvae with and without Baculovirus p35 transgene expression. Open circles represent the
no-drug control ("-"). Solid squares represent larvae cultured with drug
("L"). (A, B) Baculovirus p35 transgene on X chromosome. (C,
D) Baculovirusp35 transgeneon second chromosome. (E, F) Baculovirus
p35 transgene on third chromosome. (A, C, E) Plots of
natural-log mortality rate vs. age in days. (B, D, F) The data
were fitted to the Gompertz-Makeham model, which best described the
mortality rate. The age-independent mortality was removed and the survival
curves were re-drawn using only the Gompertz components. Mortality rate
analysis showed that age-independent mortality was significantly higher for
female larvae on drug versus control for all three Baculovirus p35
lines (Table 4).