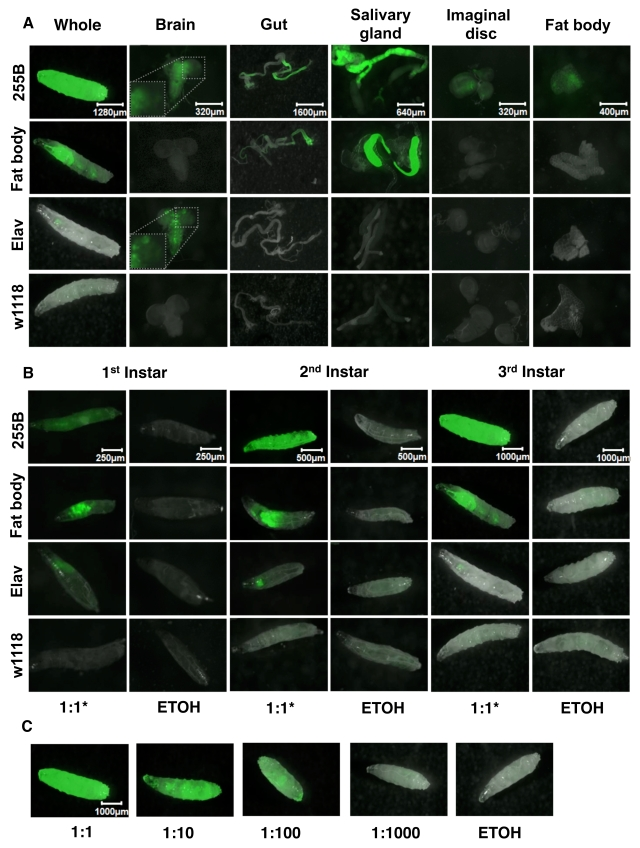
Figure 2.Expression pattern produced by GeneSwitch drivers and UAS-GFP reporter in larvae. The crosses are the same as
Figure 1, but larvae were cultured in the presence and absence of drug in
the food, from hatching to the indicated developmental stage. A.
Expression patterns in 3rd instar larvae and dissected tissues.
For the Elav-GS driver ("Elav") a 1:10 dilution of drug was used because of
the toxic effects of drug observed in larvae with this driver. Pictures
were taken at the magnification of 25X, 100X, 20X, 50X, 100X, 80X, for
whole larvae, brain, gut, salivary gland, imaginal discs, and fat body,
respectively. B. Expression patterns in the three larval stages. For Elav-GS
a 1:10 dilution of drug was used to avoid toxic effects. GFP pictures were
taken at the magnification of 100X, 50X, 25X, for 1st instar, 2nd
instar, and 3rd instar, respectively. C. Expression in 3rd
instar larvae using Act-GS-255B and titrations of drug. ETOH indicates the
ethanol solvent for the drug alone. Pictures were taken at the
magnification of 25X.