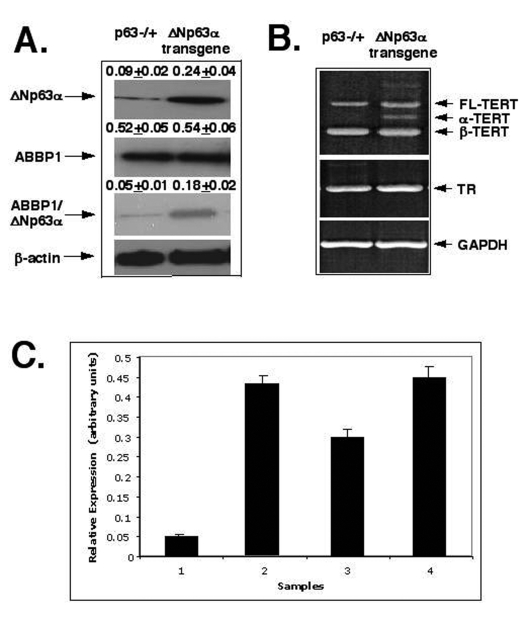
Figure 4.ΔNp63α increases levels of the mTERT-spliced isoforms via protein interaction with ABBP1. Mouse epidermal
keratinocytes (2x10⁶ cells) expressing heterozygous p63-/+
and ΔNp63α transgene.
(A) Cells were tested for the levels of ΔNp63αand ABBP1 by immunoblotting and ABBP1ΔNp63αprotein complexes
using immunoprecipitation (IP) with an antibody to ABBP1 followed by
immunoblotting with an antibody to ΔNp63α. As a control, the protein level of β-actin was
monitored.
(B) Cells were examined for the expression of the mTERT and mTR
transcripts using RT-PCR. GAPDH was used in RT-PCR assay, as a control.
(C) The relative expression of TERT and TR was quantitatively analyzed and
plotted as bars using the Microsoft Excel software. All of the data (mean +SD) were
from at least three independent experiments. Samples: cells from p63-/+ mice, 1- TERT/GAPDH ratio; 2- TR/GAPDH ratio; cells from the ΔNp63αtransgenic mice, 3- TERT/GAPDH
ratio; 4- TR/GAPDH ratio. PCR experiments with
the 2164/ 2620 set of primers generated three products that represent the
full-length TERT transcript (457 bp), the α-splice transcript
(421 bp), and the β-splice transcript (275 bp). Sequence analysis revealed that
the longer transcripts were full-length one and the shorter transcripts
were α and β- spliced messages
of mTERT.