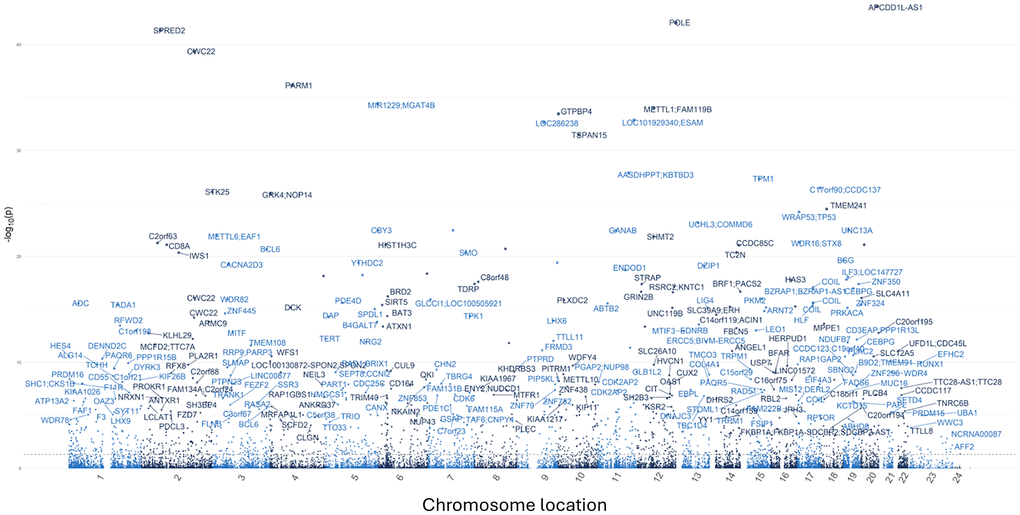
Figure 5.Manhattan plot displaying the overall genomic distribution of unique genes associated with differentially methylated CpG sites. Individual dots represent different CpG sites with the x-axis denoting their color-coded chromosomal location. The y-axis indicates the negative logarithm (base 10) of the p-value. A False Discovery Rate (FDR) lower than 0.05 was considered as a significant threshold.