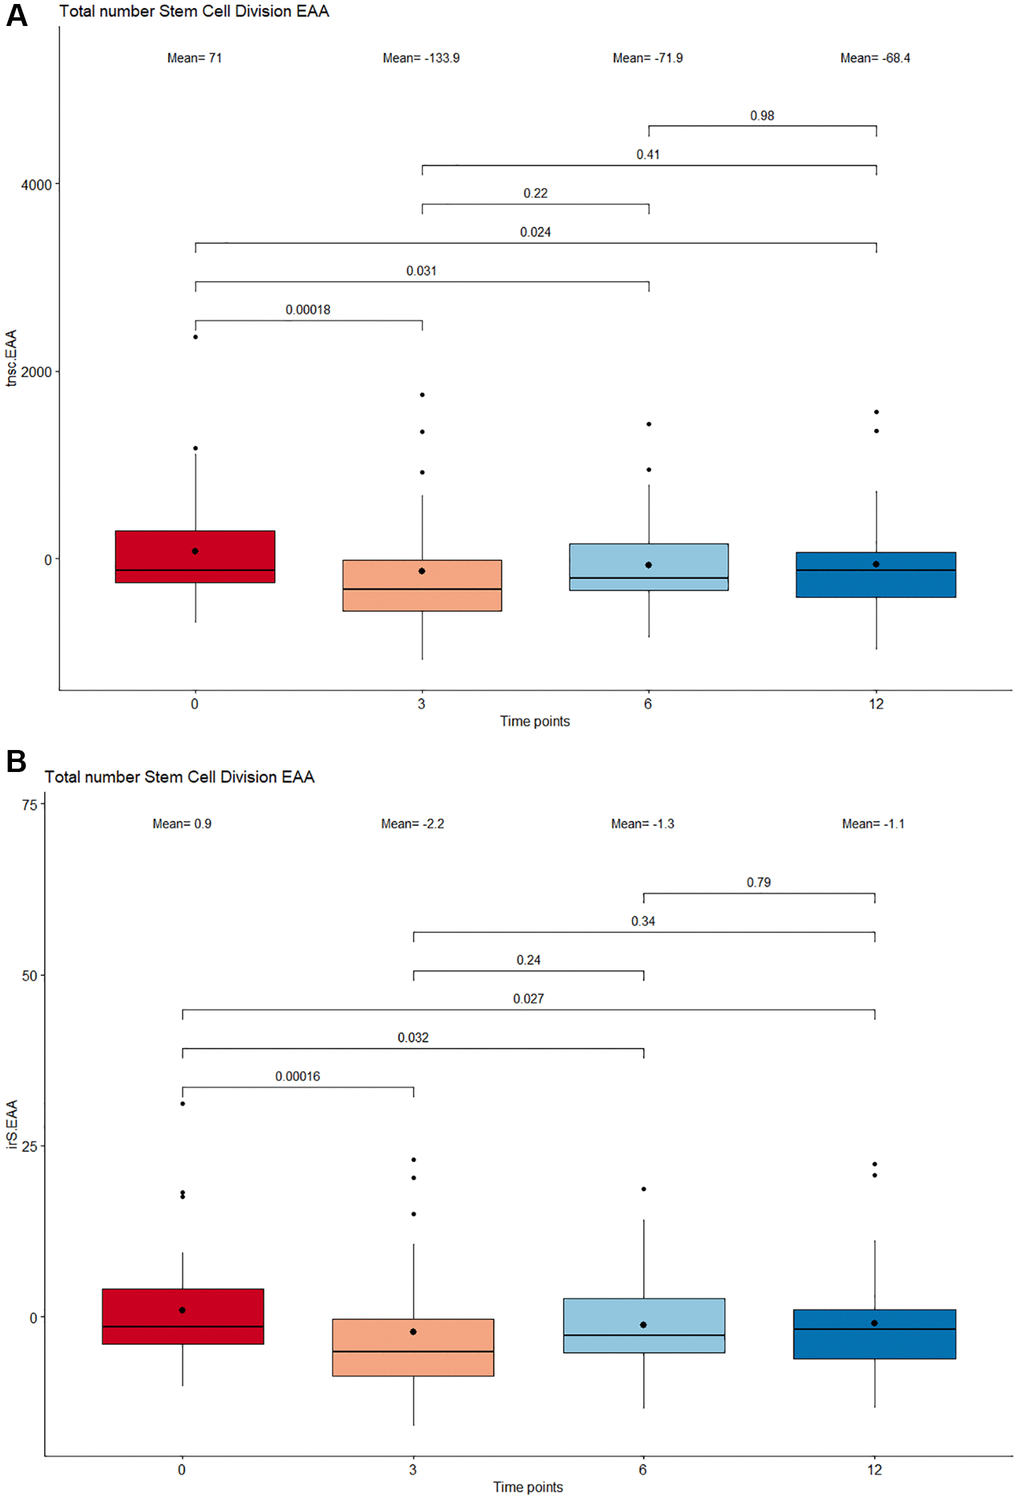
Figure 4.Boxplot showing the estimated number stem cell divisions following supplementation. (A) Total number of stem cell division (tnsc). (B) Intrinsic tissue stem cell divisions (irS). The x-axis depicts 4 different time points: 0 months, 3 months, 6 months, and 12 months. The boxes at each timepoint encompasses 50% of the estimated values. All outlier measures exceeding 1.5 times the interquartile range delimited by the vertical whiskers are displayed as individual points. The median and means are represented inside the boxes as a horizontal line and bold dot respectively. The stem cell division numbers between adjacent and nonadjacent time points were compared by a paired Wilcoxon Signed-Rank test and all p-values <0.05 were considered significant.