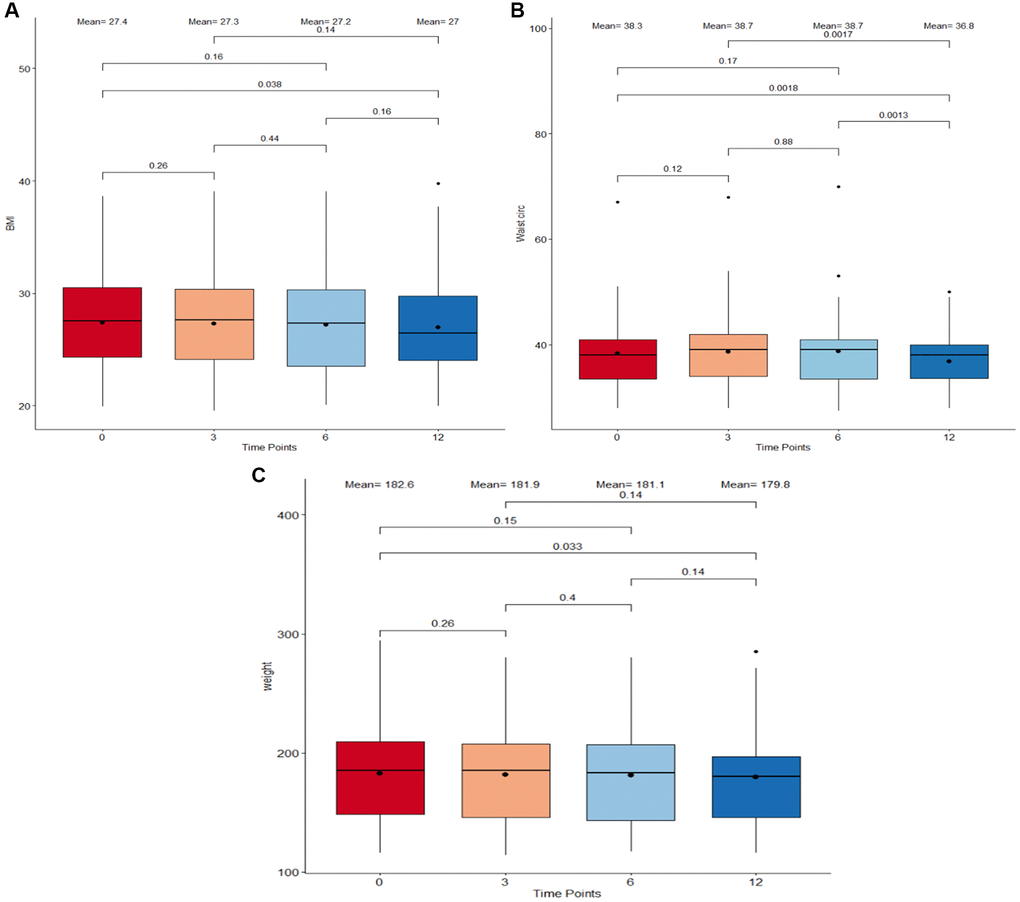
Figure 3.Boxplots detailing body composition measurements between timepoints. (A) Body Index Mass (BMI) in kg/m2. (B) Waist circumference in inches. (C) Weight in pounds. The four different time points: 0 months, 3 months, 6 months, and 12 months are plotted on the X-axis. The boxes correspond to all measurements which fall within the 25 to 75% interquartile range. The means at each time point as well as the median are displayed as a point and horizontal line respectively inside the box. All individual points which extend beyond the upper and lower limits of the IQR box plot and vertical whiskers are outlier measurements. All paired comparisons between adjacent and non-adjacent timepoints with a p-value <0.5 were considered statistically significant.