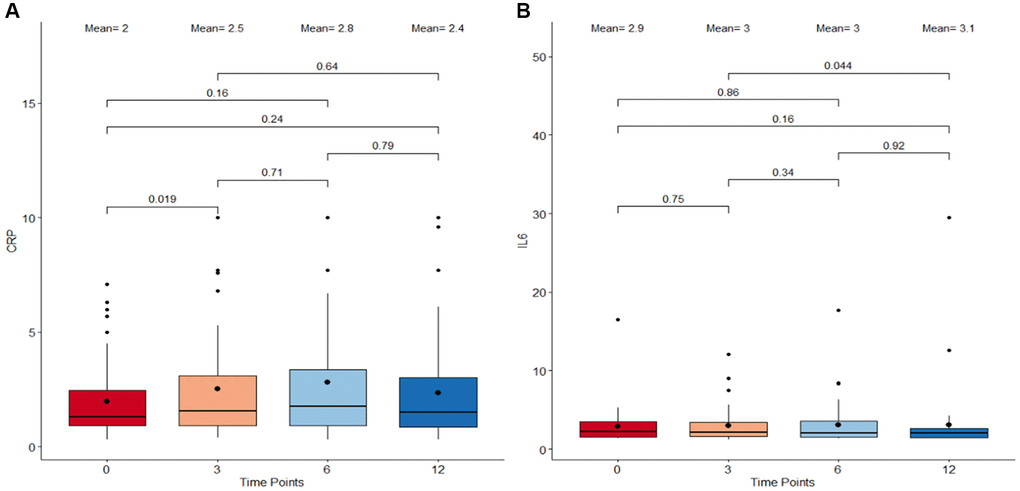
Figure 2.Boxplots detailing the levels of CRP and IL-6 immunological metrics following supplementation. (A) C-reactive protein (CRP) levels. (B) Interleukin-6 (IL-6) levels. The X-axis refers to the four different timepoints starting with 0 months as baseline, 3 months, 6 months, and 12 months as the final measure. The central boxes each represents the interquartile range (IQR) where 50% of the data at that time point lie. The vertical whiskers extend to the minimum and maximum values within 1.5 times the IQR from the first and third quartiles respectively. All the individual data points outside this range are considered outliers. The bold dot inside the box depicts the mean while the horizontal line indicates the median. Paired comparisons using Wilcoxon Signed-Rank Test were performed between adjacent as well as non-adjacent time points and any p-value <0.05 was considered statistically significant.