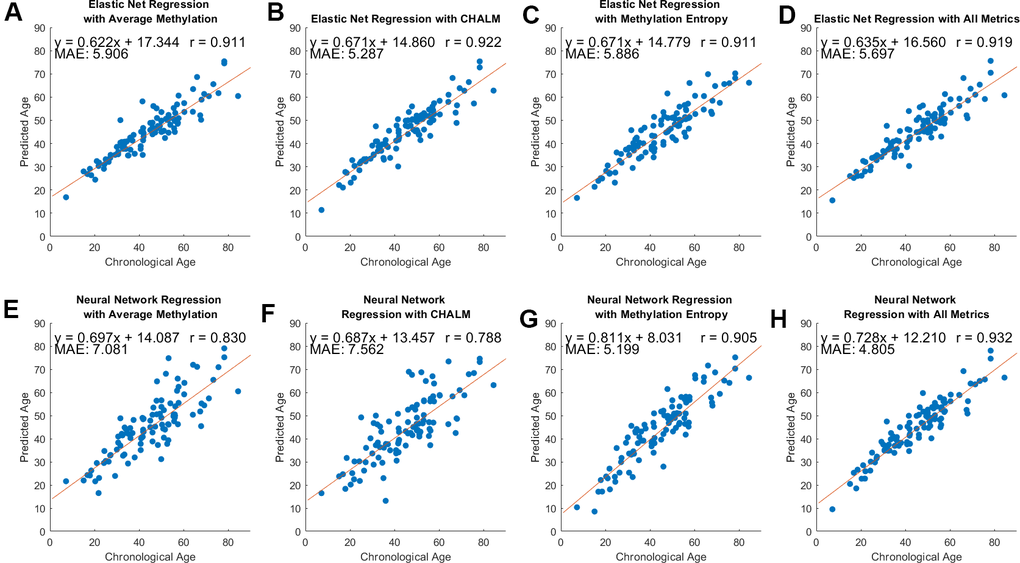
Figure 3.Model performance across three methylation metrics and two regression methods. Pearson’s correlation coefficient, equation of best-fit line, and MAE between predicted and chronological age are included. (A–D) Predicted versus chronological age using average methylation, CHALM, entropy, and a combination of these metrics with elastic net regression. (E–H) Predicted versus chronological age with neural network regression.