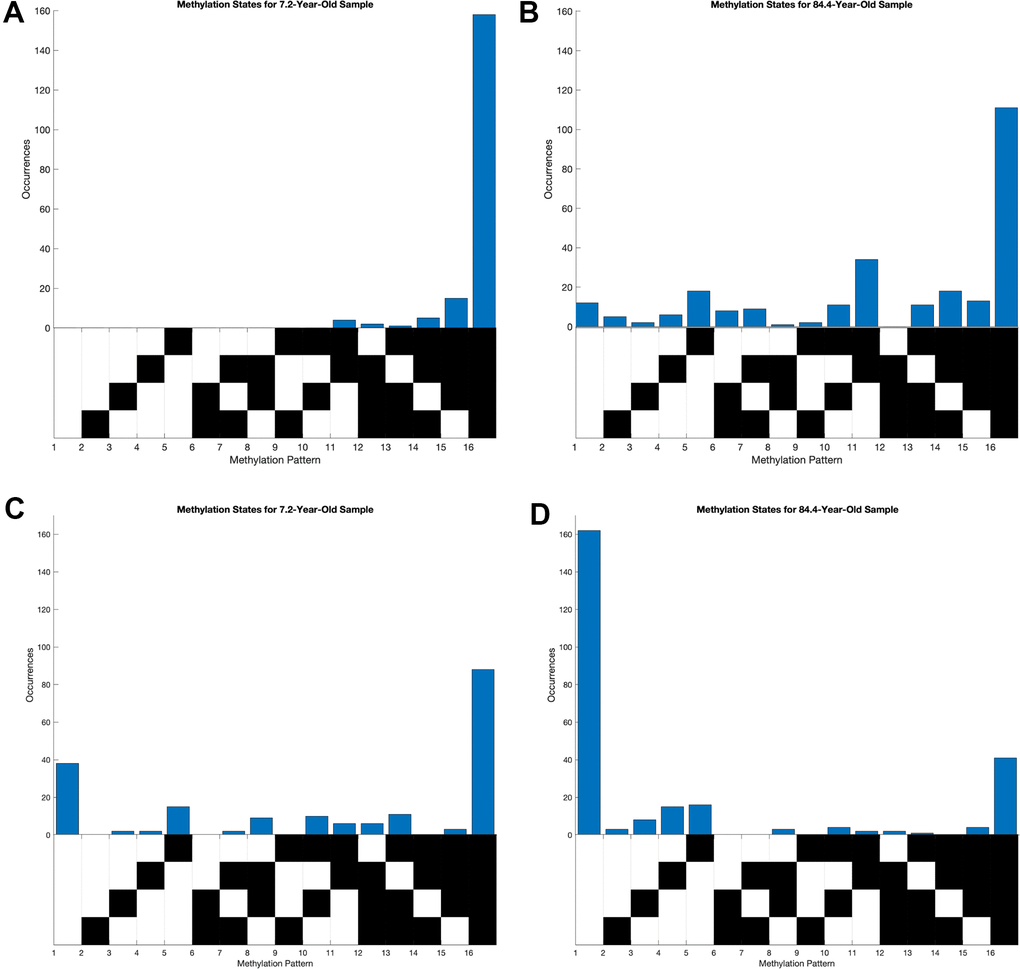
Figure 2.Distribution of methylation states of young and old samples at loci highly correlated between entropy and age. Each column of the grid below the histograms corresponds to a distinct methylation pattern, where black corresponds to an unmethylated CpG site and white corresponds to a methylated one. (A, B) Methylation pattern distributions at chr15:51681883-51681783, where average methylation and methylation entropy were positively correlated with age. (C, D) Methylation pattern distribution at chr2:101001739-101001859, where average methylation and methylation entropy were positively and negatively correlated with age, respectively.