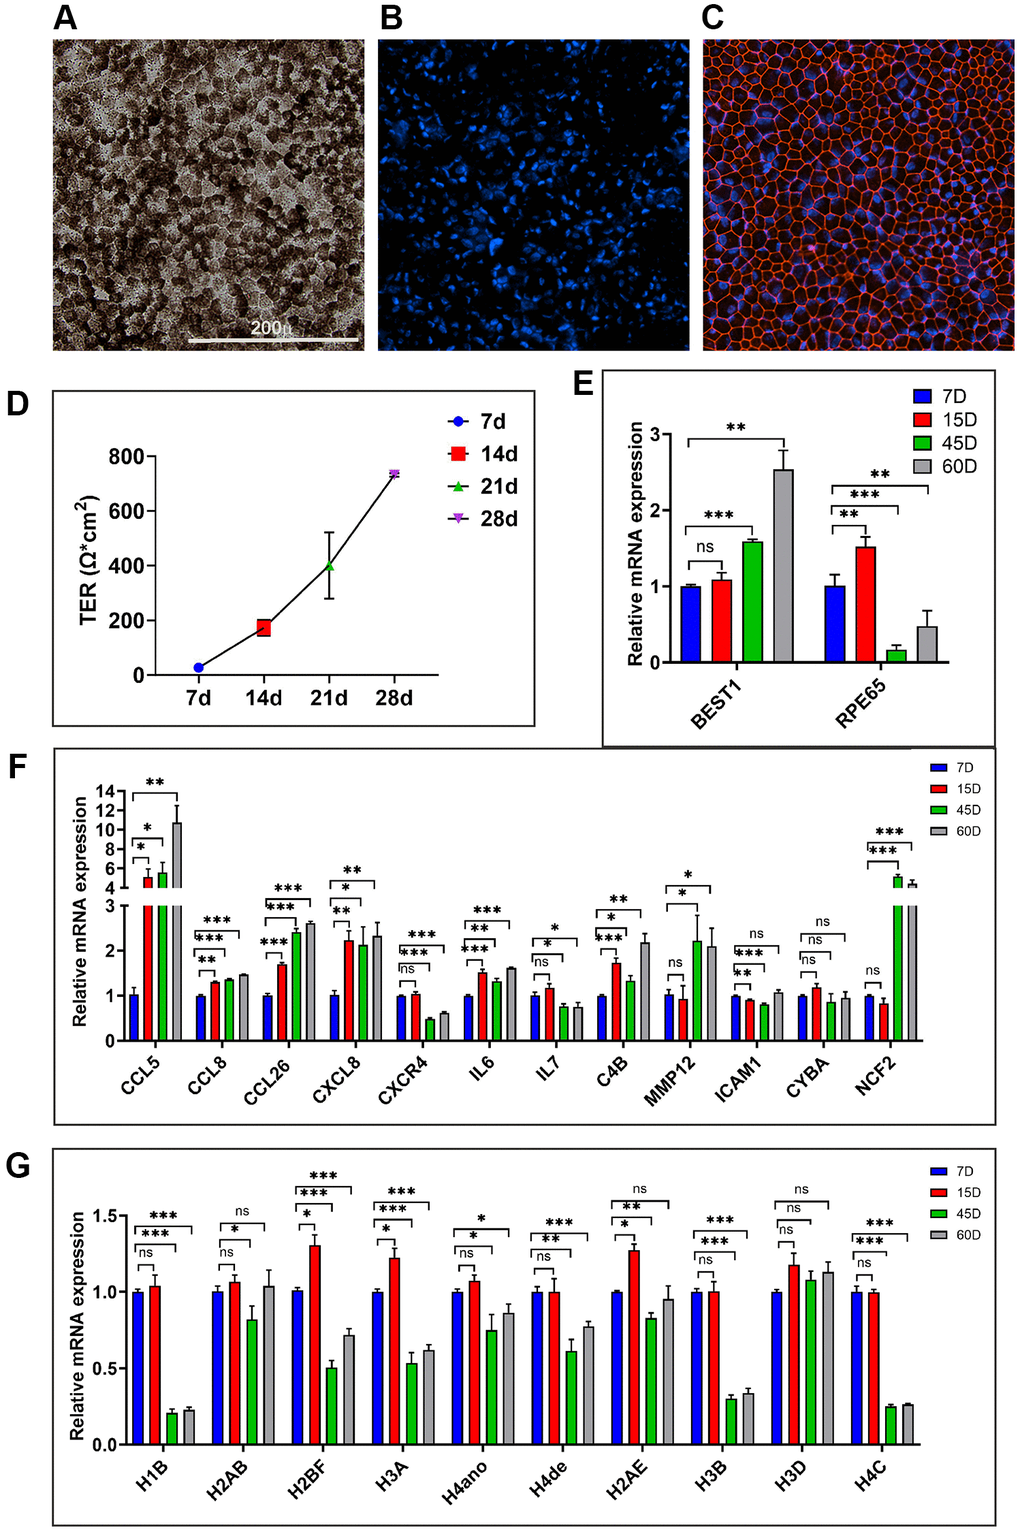
Figure 7.Evaluating the in vitro hRPE aging model. (A) Representative image of 21-day hRPE confluent cultures exhibit pigmentation and hexagonal cellular monolayers. (B, C) Representative immunofluorescence staining for the tight junction marker ZO-1 (Red) on day 21 and the nuclei are co-stained with Hoechst (Blue). (D) Time-dependent increase in TER from multiple transwells containing long-term primary hRPE cultures measured at 7/14/21 and 28 days. (E) Expression of RPE marker genes, BEST1 and RPE65 in the long-term hRPE cultures. (F, G) Relative mRNA expression levels of genes are significantly upregulated and downregulated in long-term hRPE cultures. Actin-B was used for normalization, and statistical analysis was performed using the unpaired t-test (*p < 0.05, **p < 0.01, ***p < 0.001, ns: nonsignificant). Data were presented as mean ± SEM.