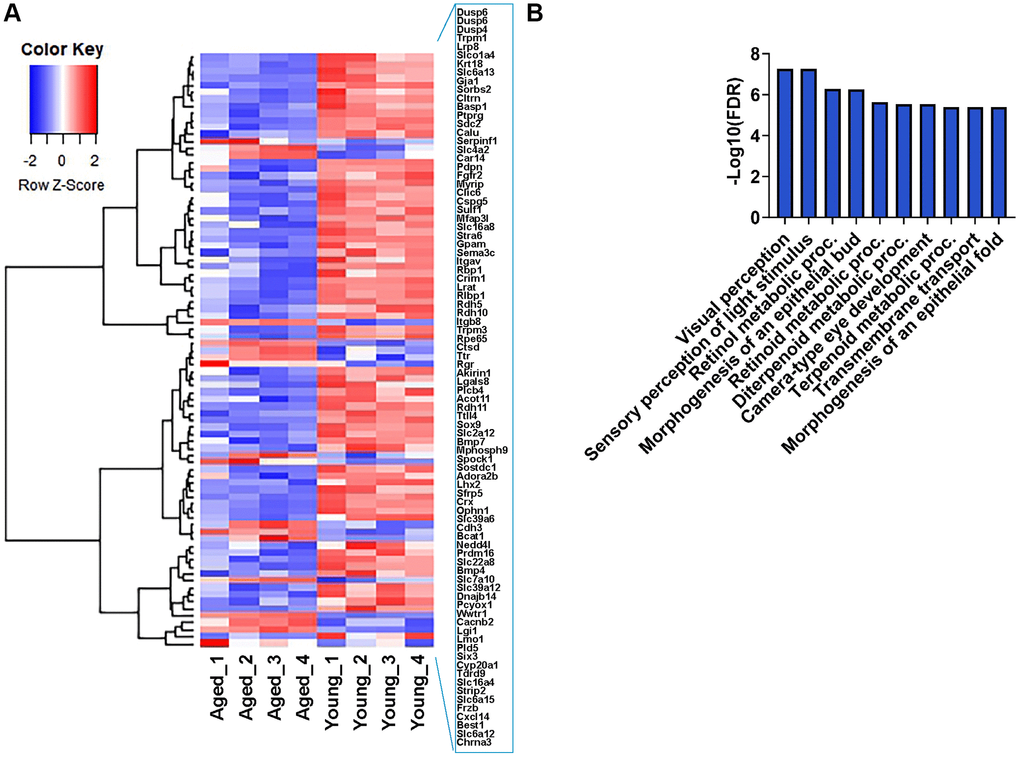
Figure 6.Expression profile of RPE-specific genes. (A) Hierarchical clustering and heatmap analysis of selected RPE-specific markers in the RPE/choroid of young and aged mice. Blue to red represents low to high gene expression. (B) GO term enrichment analysis of 67 RPE-specific genes that were downregulated in aging.