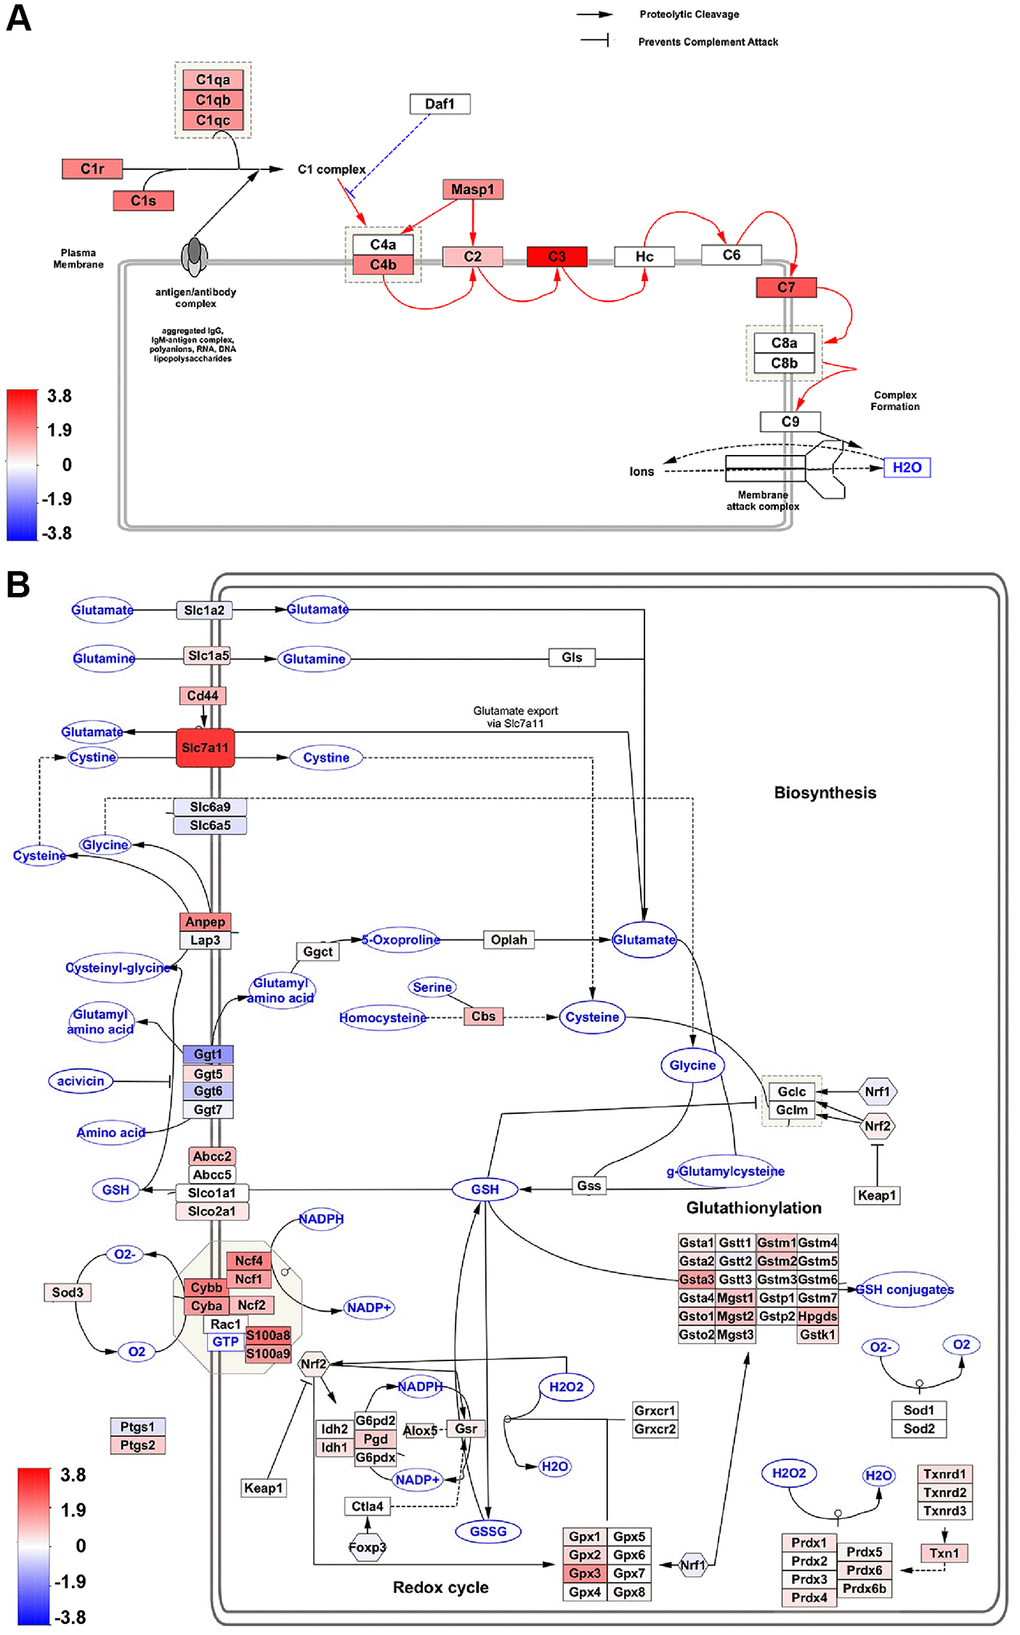
Figure 5.Pathway analysis of hub genes. (A, B) Wikipathway analysis shows Hub gene-associated pathways. The number of DEGs in our dataset that overlap with the complement activation classical pathway (A), and oxidative stress and redox pathway (B) are indicated as red (aged upregulated) or blue (aged downregulated).