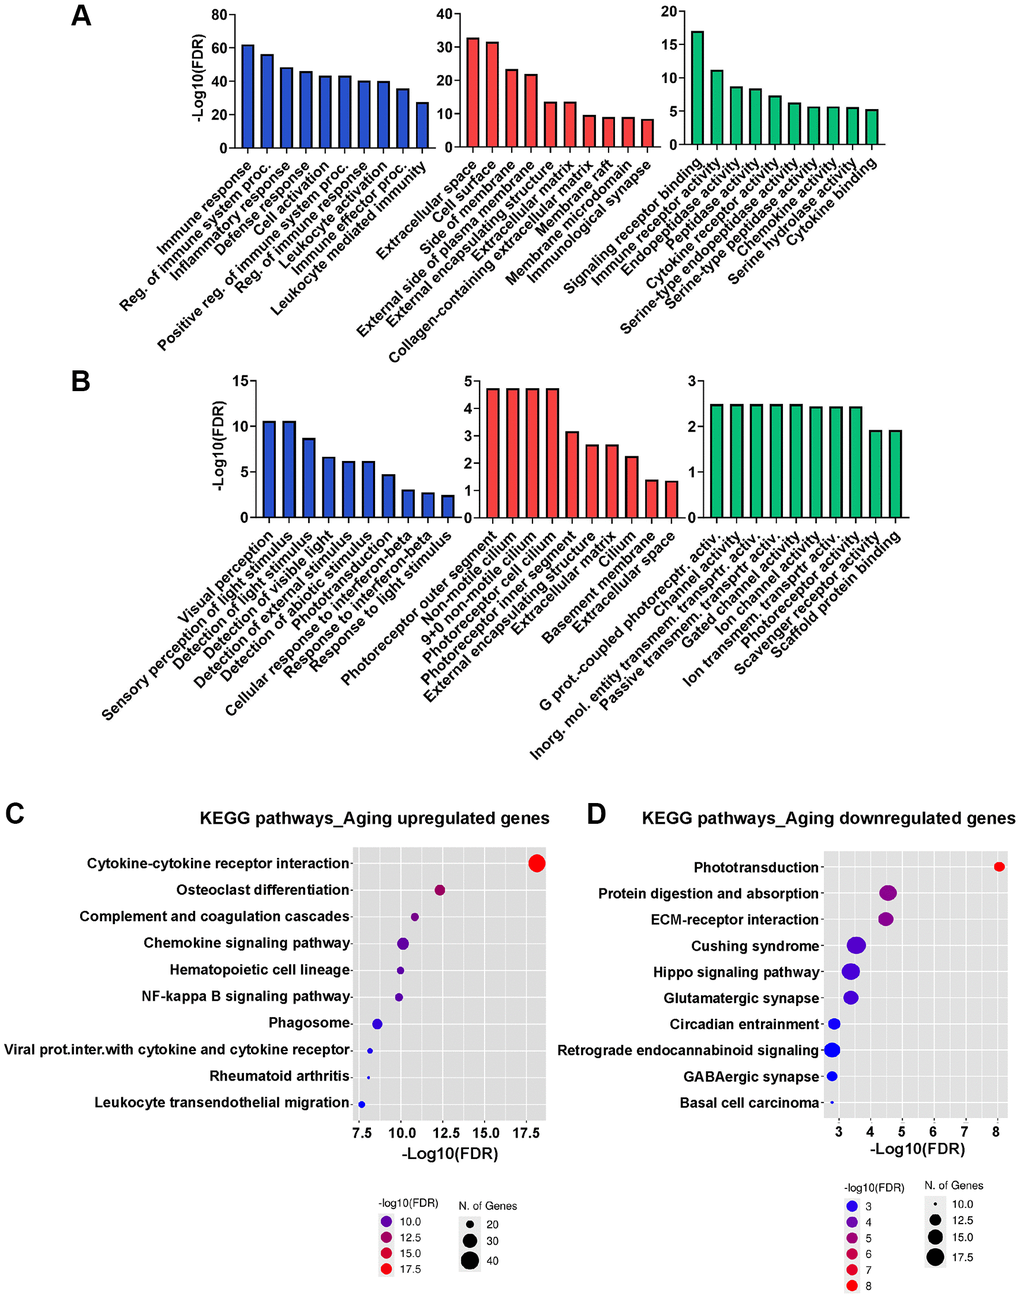
Figure 2.GO and KEGG functional enrichment analysis. (A, B) GO analysis of upregulated (A) and downregulated (B) genes in aged RPE/choroid in the BP, CC, and MF categories. The x-axis displays the top 10 most significant GO terms, and the y-axis represents the -log10 (FDR) of the enriched terms. (C, D) Dot plot showing KEGG pathway enrichment analysis of upregulated (C) and downregulated (D) genes in aged RPE/choroid. The y-axis presents the names of the top 10 enriched pathways, and the x-axis represents the -log 10 (FDR). The number of DEGs enriched in a pathway is denoted by bubble size, and the -log10 (FDR) is reflected by the bubble’s color. Abbreviations: DEGs: differentially expressed genes; GO: Gene Ontology; CC: cellular component; MF: molecular function; BP: biological process; KEGG: Kyoto Encyclopedia of Genes and Genomes.