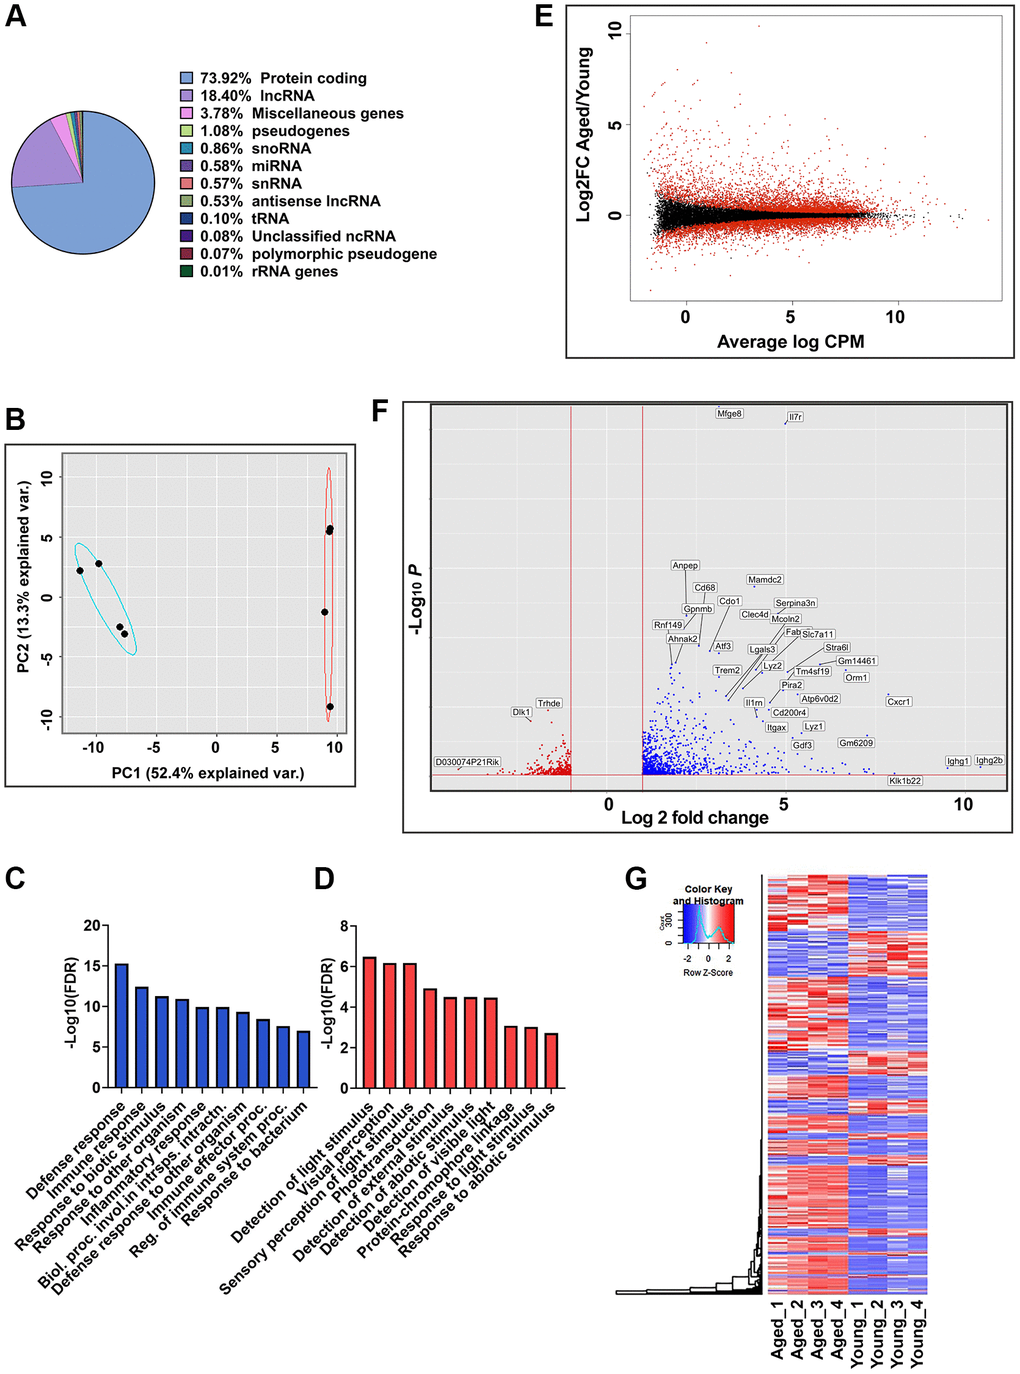
Figure 1.Global gene expression analysis in RPE/choroid of young and aged mice. (A) Pie chart represents the percent of globally expressed transcript subspecies across young (2–3 months, n = 4) and aged (22–24 months, n = 4) mice RPE/choroid from 21,376 annotated transcripts. (B) PCA plots of whole transcriptome data showed distinct clustering of young and aged mice along PC1, which captures the maximum variance (52.4%). Blue and red ellipses indicate young and aged mice and black dots represent the biological replicates (n = 4). (C, D) GO enrichment terms associated with the top 100 PC1 positive loading genes (C) and PC1 negative loading genes (D). (E) MA plot of log2 fold change versus average log counts-per-million (CPM) based on edgeR analysis showing the differential gene expression between aged and young mice RPE/choroid. Red dots indicate differentially expressed genes (FDR ≤0.05), and black dots indicate non-differentially expressed genes. (F) Volcano plot showing genes significantly (p-adj value < 0.05) upregulated (red) and downregulated (blue) in aged mice RPE/choroid. The x-axis represents log2-fold change, and the y-axis represents −log10 (p-value). The dotted line shows a cutoff of −log10 (p-value) < 0.05. Annotated dots represent the top significantly regulated genes. (G) Hierarchical clustering and heatmap analysis of gene expression in the RPE/choroid tissues of the young vs. aged mice. Blue to red represents low to high gene expression.