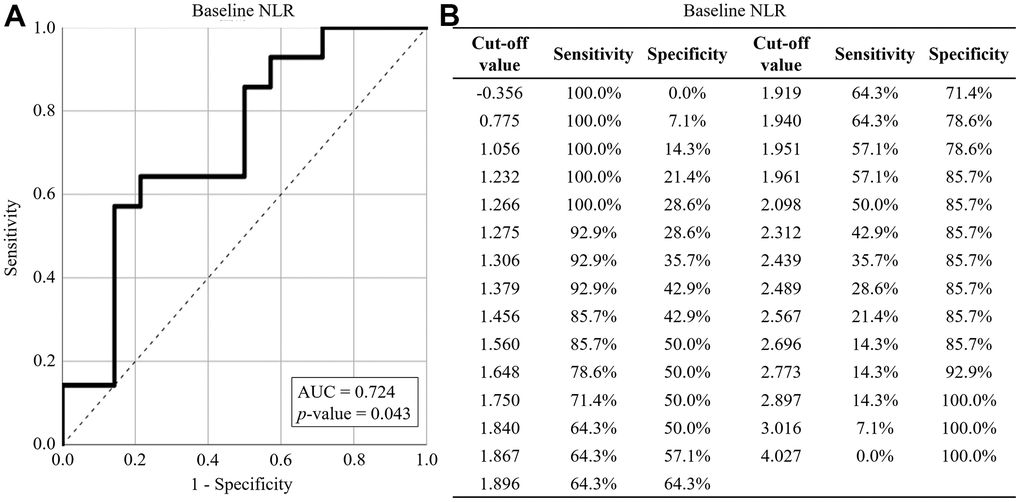
Figure 2.ROC curve analysis for ASMI reduction. (A) The performance of baseline NLR in predicting ASMI reduction. (B) The sensitivity and specificity of baseline NLR in predicting ASMI reduction. The baseline NLR was represented by solid lines, while reference lines were depicted by dashed lines. AUC: area under the curve.