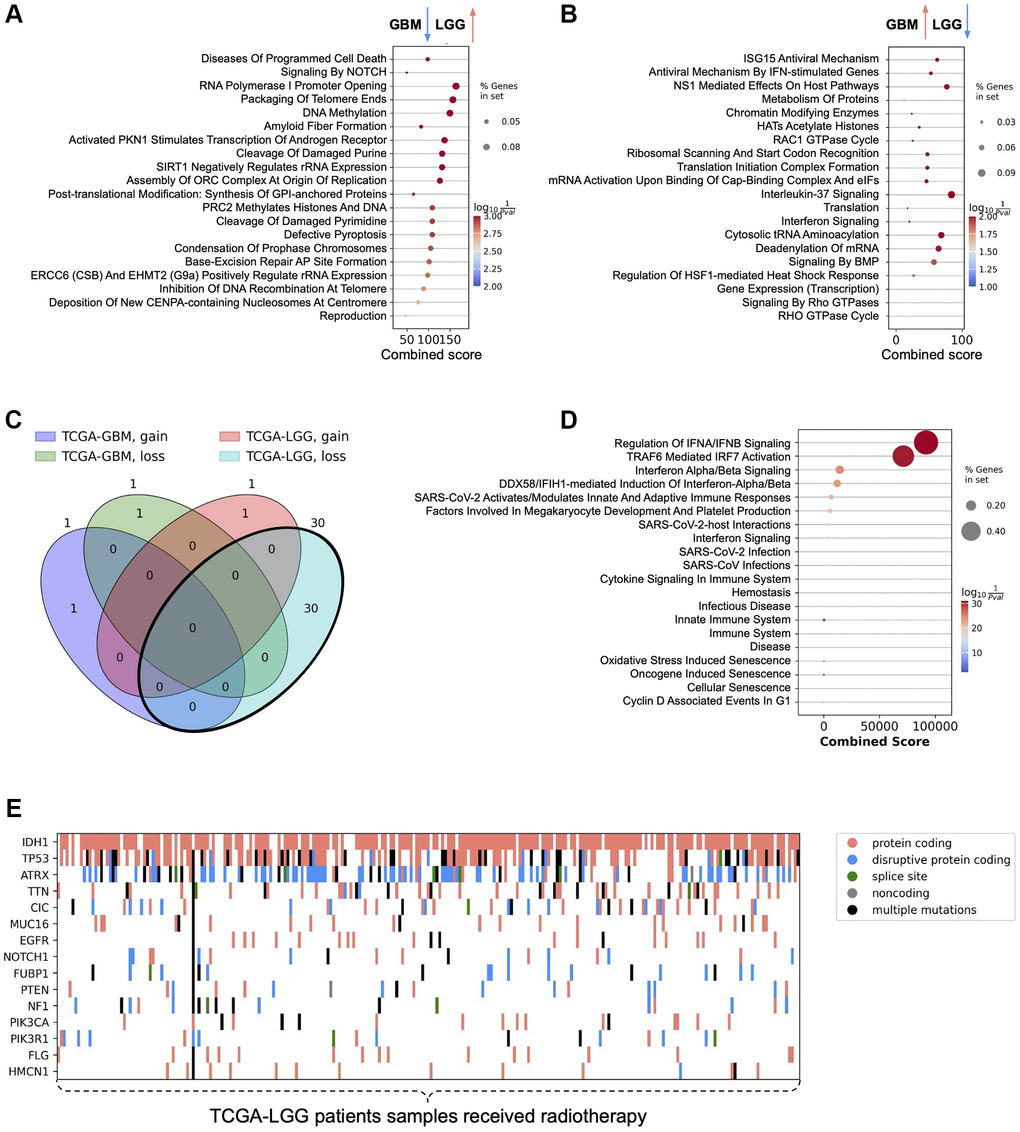
Figure 3.Signaling pathway enrichment analysis results and patients' genetic profiles. (A) Signaling pathways enriched with genes significantly down-regulated in the comparison of IR-treated and untreated GBM patients and simultaneously significantly up-regulated in the comparison of IR-treated and untreated LGG patients. (B) Signaling pathways enriched with genes significantly up-regulated in the comparison of IR-treated and untreated GBM patients and simultaneously significantly down-regulated in the comparison of IR-treated and untreated LGG patients. (C) Venn diagram describing the intersection of genes whose loss/gain status significantly stratifies IR-treated patients. (D) Signaling pathways enriched with genes whose loss status in TCGA-LGG IR-treated patients is associated with worse prognosis. (E) Mutation profile of low-grade glioma cancer tissues in patients receiving radiotherapy.