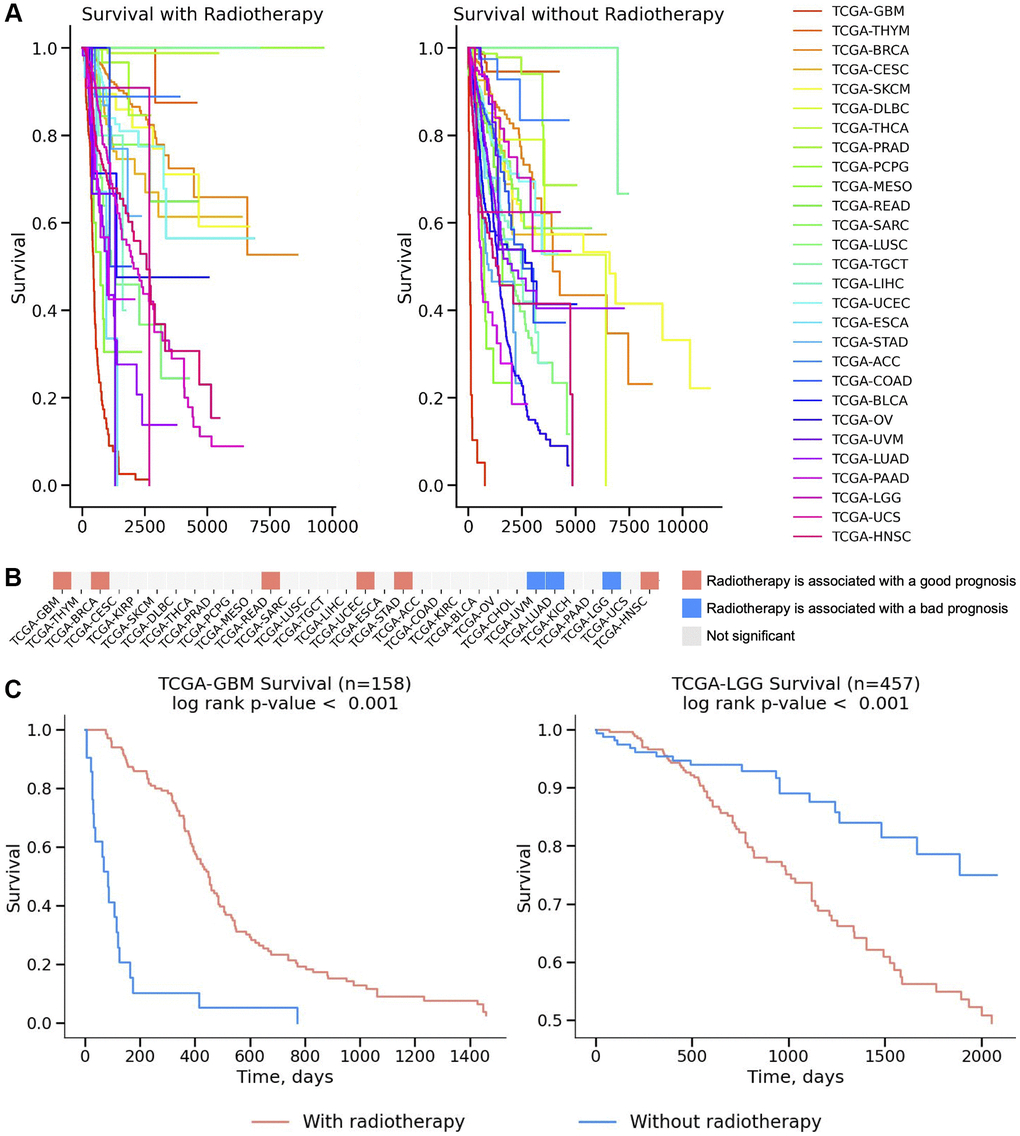
Figure 2.Survival analysis across 32 TCGA cancers. (A) Survival curves for patients who received radiotherapy and those who didn’t presented on a Kaplan-Meier plot for 32 TCGA cancers. (B) The significance of survival results is plotted on a heatmap and colored red if radiotherapy increased survival outcomes and blue if the application of radiotherapy decreased survival outcomes. Non-significant results were colored white (p-value > 0.05). The log-rank test was used to calculate statistical significance. (C) Survival analysis for IR treatment is presented on a Kaplan–Meier plot for TCGA-GBM (Glioblastoma, left figure) and TCGA-LGG (Brain Lower Grade Glioma, right figure) cancers.