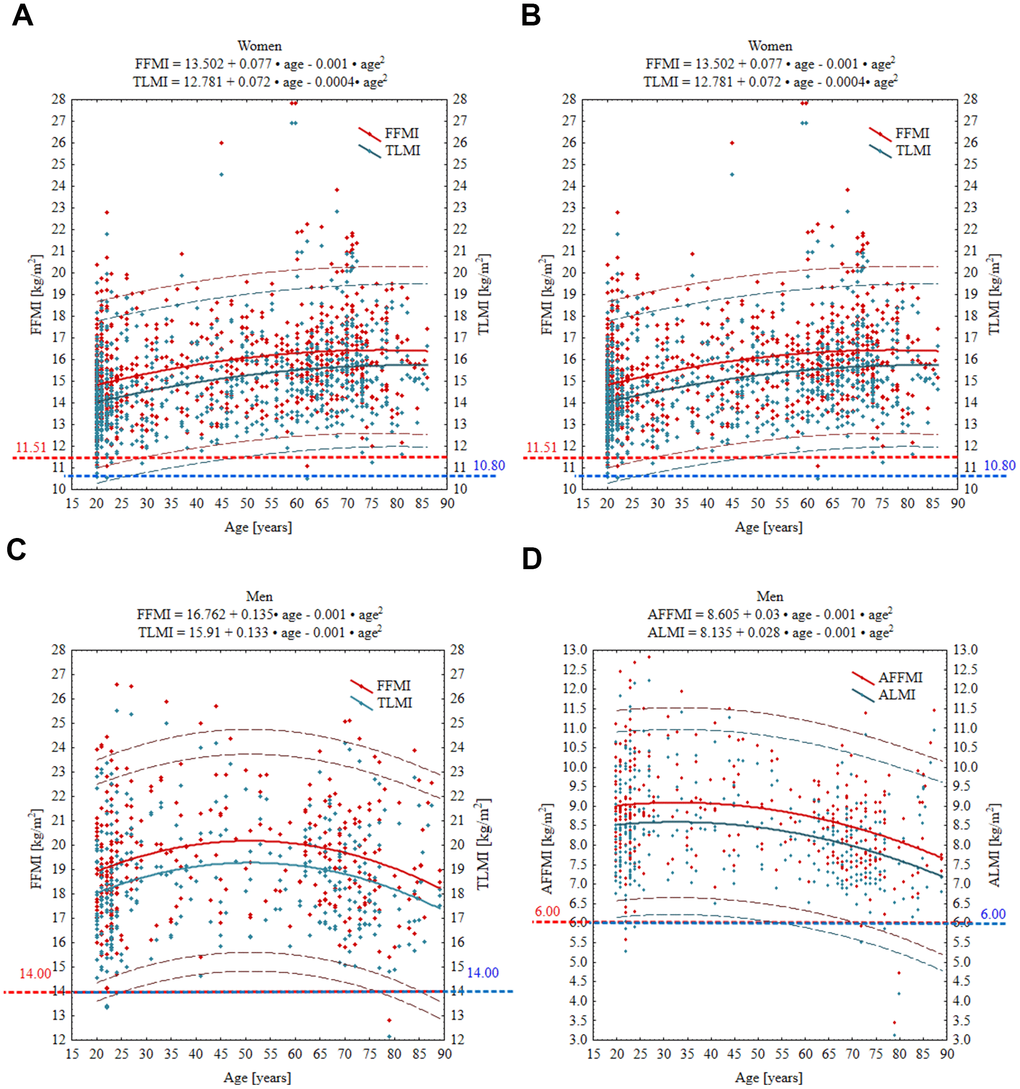
Figure 3.Age-specific curves for FFMI, TLMI, AFFMI and ALMI in women (A, B) and men (C, D). Wide solid line, the regression line; narrow dashed line, 95% prediction interval; horizontal spotted line, cut-off point equivalent to T-score of –2 SD. Red and blue numbers denote the absolute value of given parameter at T-score = –2. FFMI, fat free mass index; TLMI, total lean mass index; AFFM appendicular fat free mass index; ALMI, appendicular lean mass index.