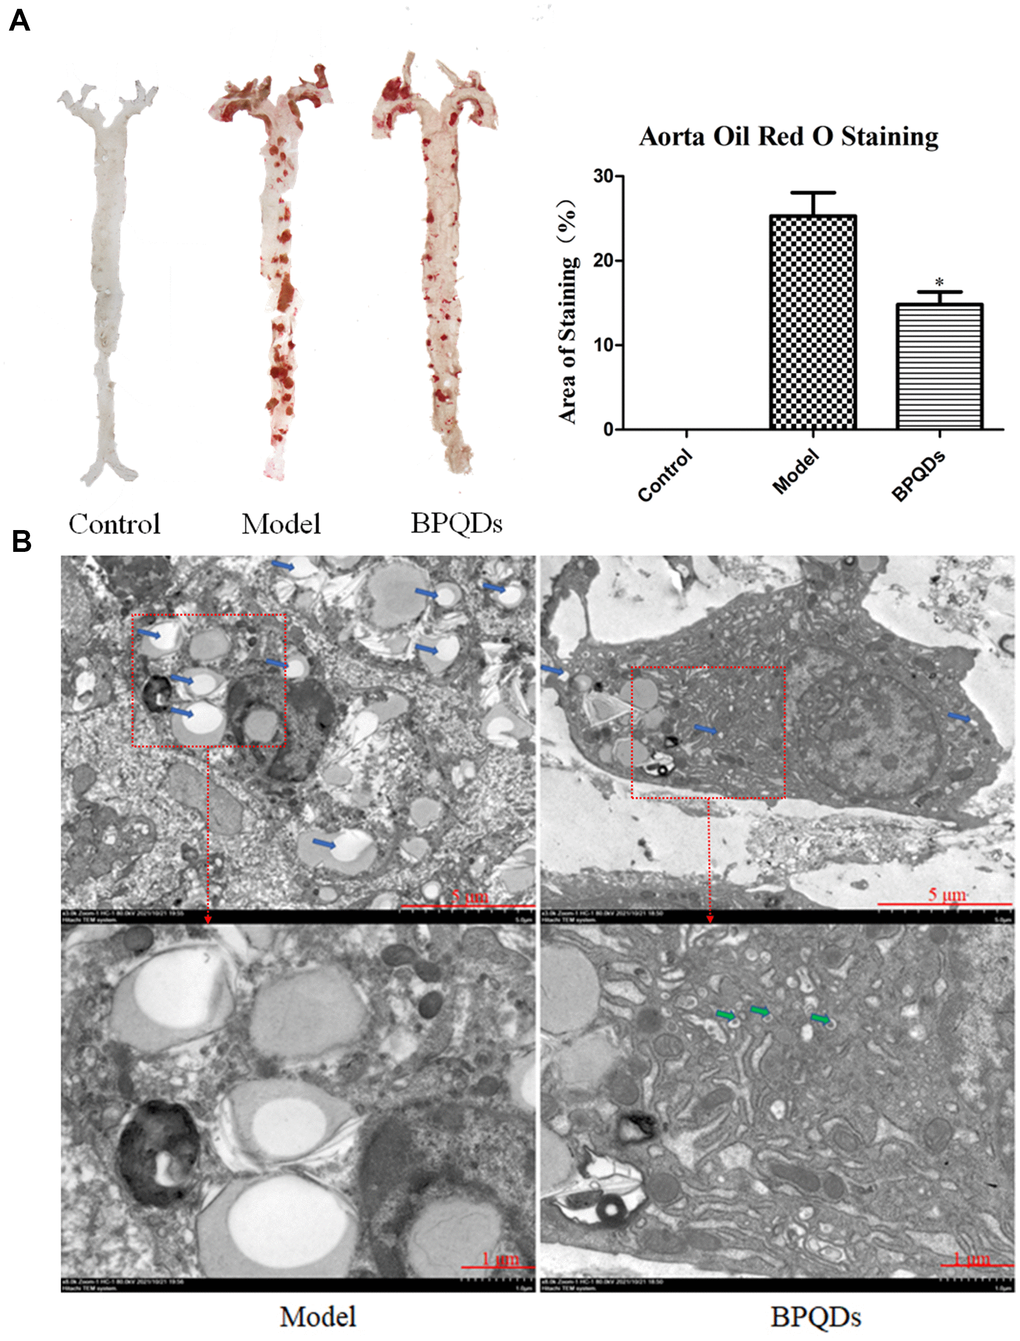
Figure 8.(A) Comparison and quantification of oil red O staining photos of aorta of mice after BPQDs treatment. (B) Comparison of electron microscopic photographs of aorta of mice treated with BPQDs. (Blue arrow: lipid droplet, green arrow: autophagosome).