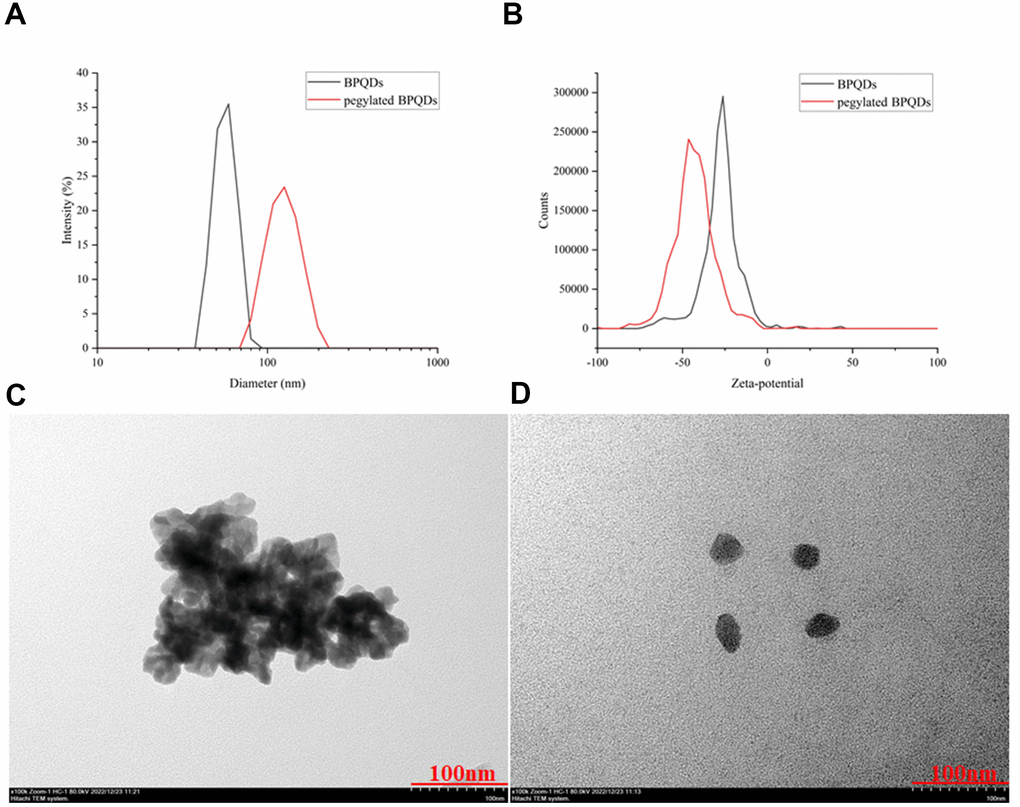
Figure 2.(A) Comparison of hydrated diameters of BPQDs after filtration in black, while pegylated BPQDs in red. (B) Zeta potential comparison of BPQDs before and after PEG2000 modification. The black solid curve represents the zeta potential distribution before modification, and the red solid curve represents the zeta potential distribution after modification. (C) 2D BPQDs tend to self-stack by π-π stacking before hydrophilic chain PEG2000 modification. (D) Pegylated BPQDs no longer agglomerated, and the stability of the emulsion was enhanced, which tended to be free to disperse.